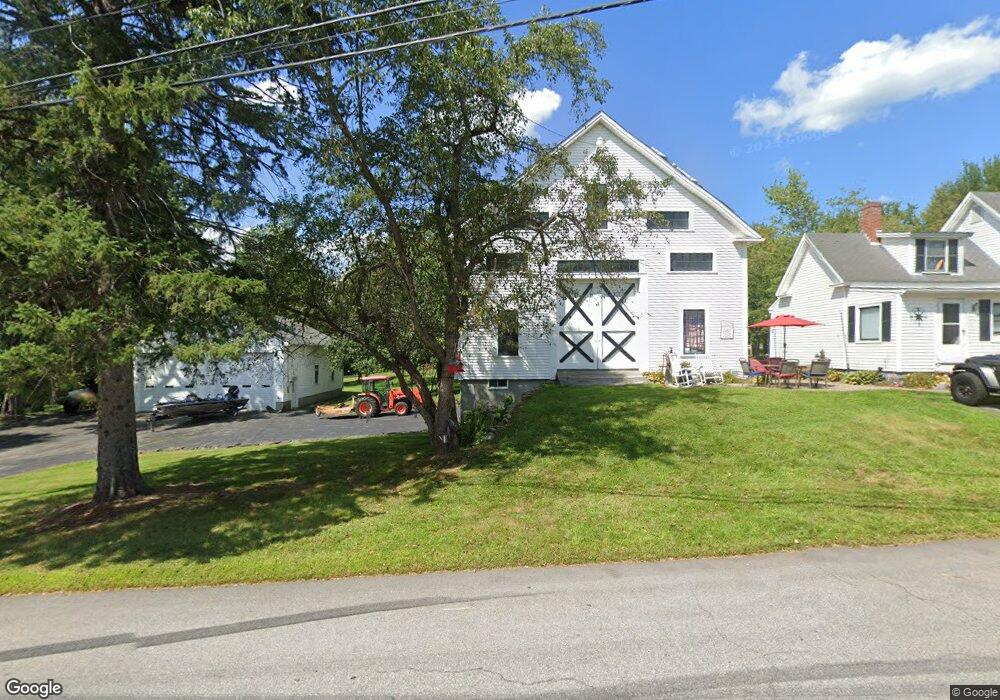
8 Higgins Rd Chichester, NH 03258
Estimated Value: $500,419 - $601,000
2
Beds
1
Bath
1,835
Sq Ft
$303/Sq Ft
Est. Value
About This Home
This home is located at 8 Higgins Rd, Chichester, NH 03258 and is currently estimated at $555,605, approximately $302 per square foot. 8 Higgins Rd is a home located in Merrimack County with nearby schools including Chichester Central School, Capital City Public Charter School (E), and East Side Learning Center.
Ownership History
Date
Name
Owned For
Owner Type
Purchase Details
Closed on
Sep 22, 2022
Sold by
Moses Brent B
Bought by
Hershey David and Miner Matthew
Current Estimated Value
Home Financials for this Owner
Home Financials are based on the most recent Mortgage that was taken out on this home.
Original Mortgage
$295,000
Outstanding Balance
$280,168
Interest Rate
5.22%
Mortgage Type
Purchase Money Mortgage
Estimated Equity
$275,437
Purchase Details
Closed on
Feb 8, 2011
Sold by
Marquis Regina
Bought by
Jerome David J and Jerome Carole A
Home Financials for this Owner
Home Financials are based on the most recent Mortgage that was taken out on this home.
Original Mortgage
$40,000
Interest Rate
4.88%
Mortgage Type
Unknown
Purchase Details
Closed on
Jun 10, 2010
Sold by
Aversa Daniel F
Bought by
Marquis Regina
Purchase Details
Closed on
May 20, 2010
Sold by
Moses Brent A
Bought by
Aversa Daniel F
Create a Home Valuation Report for This Property
The Home Valuation Report is an in-depth analysis detailing your home's value as well as a comparison with similar homes in the area
Home Values in the Area
Average Home Value in this Area
Purchase History
| Date | Buyer | Sale Price | Title Company |
|---|---|---|---|
| Hershey David | $445,000 | None Available | |
| Jerome David J | $264,300 | -- | |
| Marquis Regina | $75,000 | -- | |
| Aversa Daniel F | $80,000 | -- |
Source: Public Records
Mortgage History
| Date | Status | Borrower | Loan Amount |
|---|---|---|---|
| Open | Hershey David | $295,000 | |
| Previous Owner | Aversa Daniel F | $40,000 | |
| Previous Owner | Aversa Daniel F | $211,377 | |
| Previous Owner | Aversa Daniel F | $30,000 |
Source: Public Records
Tax History
| Year | Tax Paid | Tax Assessment Tax Assessment Total Assessment is a certain percentage of the fair market value that is determined by local assessors to be the total taxable value of land and additions on the property. | Land | Improvement |
|---|---|---|---|---|
| 2025 | $8,359 | $468,800 | $195,300 | $273,500 |
| 2024 | $8,124 | $468,800 | $195,300 | $273,500 |
| 2023 | $7,698 | $468,800 | $195,300 | $273,500 |
| 2022 | $7,468 | $306,300 | $116,500 | $189,800 |
| 2021 | $7,076 | $306,300 | $116,500 | $189,800 |
| 2020 | $7,100 | $306,300 | $116,500 | $189,800 |
| 2019 | $7,167 | $306,300 | $116,500 | $189,800 |
| 2018 | $7,174 | $306,300 | $116,500 | $189,800 |
| 2017 | $6,633 | $239,300 | $75,000 | $164,300 |
| 2016 | $6,535 | $239,300 | $75,000 | $164,300 |
| 2015 | $6,310 | $239,300 | $75,000 | $164,300 |
| 2014 | $6,413 | $239,300 | $75,000 | $164,300 |
| 2013 | $6,059 | $239,300 | $75,000 | $164,300 |
Source: Public Records
Map
Nearby Homes
- 762 Robinson Rd
- 361 Dover Rd
- 296 Loudon Rd
- 306 Portsmouth St
- 0 Ricker Rd Unit 1
- 12 Chestnut Cir
- 28 Willow Terrace
- 84 Branch Turnpike Unit 101
- 83 NE Village Rd
- 41 NE Village Rd
- 54 NE Village Rd
- 8 NE Village Rd
- 58 Branch Turnpike Unit 73
- 58 Branch Turnpike Unit 26
- 169 Portsmouth St Unit 4
- 169 Portsmouth St Unit 14
- 185 Loudon Rd Unit 8
- 62 Hampton St
- 12 E Side Dr Unit 4-13
- 12 E Side Dr Unit 13
Your Personal Tour Guide
Ask me questions while you tour the home.