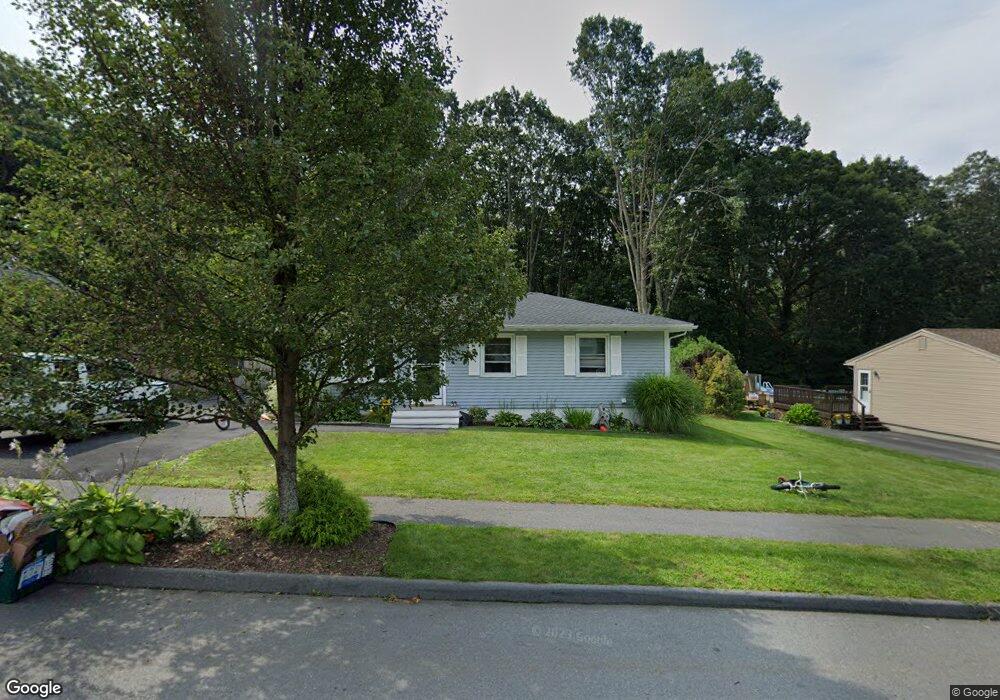
8 Hingham Rd Worcester, MA 01606
Indian Hill NeighborhoodEstimated Value: $402,000 - $453,000
3
Beds
1
Bath
960
Sq Ft
$445/Sq Ft
Est. Value
About This Home
This home is located at 8 Hingham Rd, Worcester, MA 01606 and is currently estimated at $427,672, approximately $445 per square foot. 8 Hingham Rd is a home located in Worcester County with nearby schools including Nelson Place Elementary School, Jacob Hiatt Magnet School, and Chandler Magnet.
Ownership History
Date
Name
Owned For
Owner Type
Purchase Details
Closed on
Dec 31, 2010
Sold by
Us Bk
Bought by
Reilly Katie J and Donahue Timohty J
Current Estimated Value
Home Financials for this Owner
Home Financials are based on the most recent Mortgage that was taken out on this home.
Original Mortgage
$143,925
Outstanding Balance
$96,180
Interest Rate
4.37%
Mortgage Type
Purchase Money Mortgage
Estimated Equity
$331,492
Purchase Details
Closed on
Jun 11, 2010
Sold by
Parks Bradley C
Bought by
Us Bk
Purchase Details
Closed on
Oct 27, 2000
Sold by
Talbot Karen J
Bought by
Parks Bradley C and Parks Jennifer A
Home Financials for this Owner
Home Financials are based on the most recent Mortgage that was taken out on this home.
Original Mortgage
$142,638
Interest Rate
7.83%
Mortgage Type
Purchase Money Mortgage
Purchase Details
Closed on
Jun 29, 1998
Sold by
Mohamed Rita
Bought by
Foss Karen J
Home Financials for this Owner
Home Financials are based on the most recent Mortgage that was taken out on this home.
Original Mortgage
$93,100
Interest Rate
7.09%
Mortgage Type
Purchase Money Mortgage
Create a Home Valuation Report for This Property
The Home Valuation Report is an in-depth analysis detailing your home's value as well as a comparison with similar homes in the area
Home Values in the Area
Average Home Value in this Area
Purchase History
| Date | Buyer | Sale Price | Title Company |
|---|---|---|---|
| Reilly Katie J | $150,000 | -- | |
| Us Bk | $170,000 | -- | |
| Parks Bradley C | $143,000 | -- | |
| Foss Karen J | $108,100 | -- |
Source: Public Records
Mortgage History
| Date | Status | Borrower | Loan Amount |
|---|---|---|---|
| Open | Reilly Katie J | $143,925 | |
| Previous Owner | Foss Karen J | $164,000 | |
| Previous Owner | Foss Karen J | $159,000 | |
| Previous Owner | Foss Karen J | $142,638 | |
| Previous Owner | Foss Karen J | $93,100 |
Source: Public Records
Tax History
| Year | Tax Paid | Tax Assessment Tax Assessment Total Assessment is a certain percentage of the fair market value that is determined by local assessors to be the total taxable value of land and additions on the property. | Land | Improvement |
|---|---|---|---|---|
| 2025 | $5,252 | $398,200 | $118,700 | $279,500 |
| 2024 | $5,132 | $373,200 | $118,700 | $254,500 |
| 2023 | $5,058 | $352,700 | $103,200 | $249,500 |
| 2022 | $4,490 | $295,200 | $82,600 | $212,600 |
| 2021 | $4,407 | $270,700 | $66,100 | $204,600 |
| 2020 | $3,936 | $231,500 | $66,100 | $165,400 |
| 2019 | $3,695 | $205,300 | $59,500 | $145,800 |
| 2018 | $3,582 | $189,400 | $59,500 | $129,900 |
| 2017 | $3,638 | $189,300 | $59,500 | $129,800 |
| 2016 | $3,221 | $156,300 | $43,700 | $112,600 |
| 2015 | $3,137 | $156,300 | $43,700 | $112,600 |
| 2014 | $3,054 | $156,300 | $43,700 | $112,600 |
Source: Public Records
Map
Nearby Homes
- 120 Brattle St
- 41 Mohave Rd
- 270 Brattle St
- 37 Mohave Rd
- 42 N Worcester Ave
- 30 Danielles Way
- 39 Mountainshire Dr
- 82 Holden St
- 90 Bjorklund Ave
- 39 Whitmarsh Ave
- 97 Parkton Ave
- 158 Chester St
- 53 Collins St
- 250 Shrewsbury St
- 12 Tattan Farm Rd
- 25 Chester St
- 667 Grove St
- 169 Whitmarsh Ave
- 31 Danielles Way
- 22 Danielles Way
Your Personal Tour Guide
Ask me questions while you tour the home.