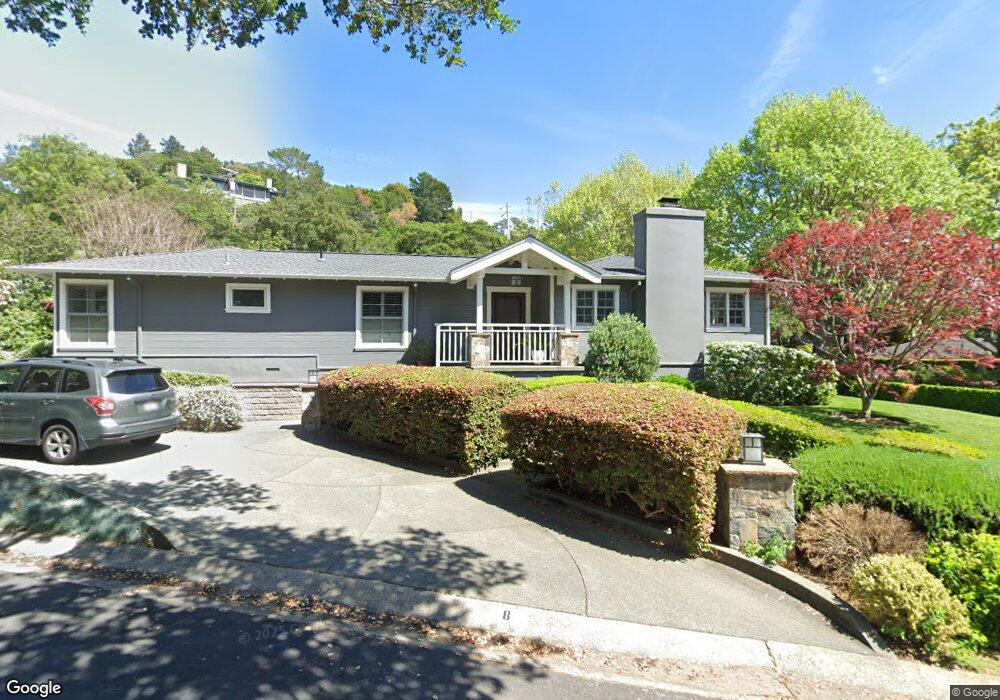
8 La Cuesta Dr Greenbrae, CA 94904
Greenbrae/Larkspur Landing NeighborhoodEstimated Value: $2,719,000 - $3,657,325
4
Beds
3
Baths
2,574
Sq Ft
$1,212/Sq Ft
Est. Value
About This Home
This home is located at 8 La Cuesta Dr, Greenbrae, CA 94904 and is currently estimated at $3,120,081, approximately $1,212 per square foot. 8 La Cuesta Dr is a home located in Marin County with nearby schools including Anthony G. Bacich Elementary School, Adaline E. Kent Middle School, and Redwood High School.
Ownership History
Date
Name
Owned For
Owner Type
Purchase Details
Closed on
Jun 22, 2015
Sold by
Hobbs Tyler Colvin and Gough Regan Hirano
Bought by
The Tyler Colvin Hobbs & Regan Hirano Go and Hirano Gough Regan
Current Estimated Value
Home Financials for this Owner
Home Financials are based on the most recent Mortgage that was taken out on this home.
Original Mortgage
$1,697,500
Outstanding Balance
$1,302,921
Interest Rate
3.5%
Mortgage Type
Adjustable Rate Mortgage/ARM
Estimated Equity
$1,817,160
Purchase Details
Closed on
Mar 20, 2015
Sold by
Soden Thomas J and Soden Kathleen P
Bought by
Gough Regan and Hobbs Tyler
Purchase Details
Closed on
Apr 22, 2008
Sold by
Soden Thomas J
Bought by
Soden Thomas J and Soden Kathleen P
Create a Home Valuation Report for This Property
The Home Valuation Report is an in-depth analysis detailing your home's value as well as a comparison with similar homes in the area
Home Values in the Area
Average Home Value in this Area
Purchase History
| Date | Buyer | Sale Price | Title Company |
|---|---|---|---|
| The Tyler Colvin Hobbs & Regan Hirano Go | -- | Fidelity National Title Co | |
| Gough Regan | $2,450,000 | Fidelity National Title Co | |
| Soden Thomas J | -- | None Available | |
| Soden Thomas J | -- | None Available |
Source: Public Records
Mortgage History
| Date | Status | Borrower | Loan Amount |
|---|---|---|---|
| Open | The Tyler Colvin Hobbs & Regan Hirano Go | $1,697,500 |
Source: Public Records
Tax History Compared to Growth
Tax History
| Year | Tax Paid | Tax Assessment Tax Assessment Total Assessment is a certain percentage of the fair market value that is determined by local assessors to be the total taxable value of land and additions on the property. | Land | Improvement |
|---|---|---|---|---|
| 2025 | $39,199 | $3,293,697 | $1,802,715 | $1,490,982 |
| 2024 | $39,199 | $3,179,128 | $1,767,375 | $1,411,753 |
| 2023 | $38,103 | $3,087,389 | $1,732,725 | $1,354,664 |
| 2022 | $37,251 | $2,958,225 | $1,698,750 | $1,259,475 |
| 2021 | $36,663 | $2,900,235 | $1,665,450 | $1,234,785 |
| 2020 | $34,279 | $2,692,354 | $1,648,380 | $1,043,974 |
| 2019 | $33,310 | $2,639,581 | $1,616,070 | $1,023,511 |
| 2018 | $32,767 | $2,587,837 | $1,584,390 | $1,003,447 |
| 2017 | $31,396 | $2,537,097 | $1,553,325 | $983,772 |
| 2016 | $30,444 | $2,487,362 | $1,522,875 | $964,487 |
| 2015 | $14,438 | $1,055,467 | $453,325 | $602,142 |
| 2014 | $12,673 | $1,034,800 | $444,449 | $590,351 |
Source: Public Records
Map
Nearby Homes
- 290 Via Casitas Unit 206
- 320 Via Casitas Unit 109
- 175 Upper Via Casitas Unit 2
- 50 Via Belardo Unit 12
- 955 Via Casitas
- 804 Via Casitas
- 296 N Almenar Dr
- 59 Almenar Dr
- 47 Elizabeth Cir
- 1 Drakes View Cir
- 321 N Almenar Dr
- 34 Boardwalk One
- 40 Corte Real
- 334 Riviera Cir
- 45 Corte Real Unit 8
- 254 Riviera Cir
- 202 Riviera Cir
- 10 Hazel Ct
- 325 Via la Cumbre
- 362 Larkspur Plaza Dr Unit 362
- 10 La Cuesta Dr
- 103 Bretano Way
- 100 Bretano Way
- 12 La Cuesta Dr
- 105 Bretano Way
- 2 Los Cerros Dr
- 102 Bretano Way
- 14 La Cuesta Dr
- 2 La Cuesta Dr
- 107 Bretano Way
- 9 La Cuesta Dr
- 111 Bretano Way
- 11 La Cuesta Dr
- 104 Bretano Way
- 1 La Cuesta Dr
- 23 Corte Morada
- 1 Los Cerros Dr
- 4 Los Cerros Dr
- 109 Bretano Way
- 16 La Cuesta Dr