
Seller's Agent in 2024
John Roy
Galactic Realty Group LLC
(603) 625-2468
1 in this area
73 Total Sales
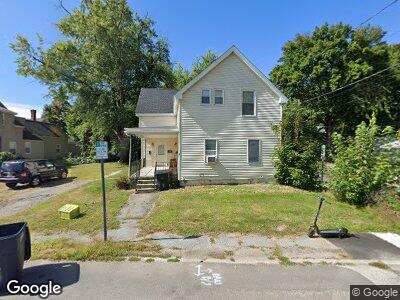
This newly renovated 1BR/1BA townhouse-style unit showcases an unbeatable location just steps away from downtown Nashua, offering an array of recreational opportunities and nurturing a vibrant community atmosphere. Whether you're meandering through the bustling streets to discover unique shopping and dining experiences, basking in the verdant beauty of North Common Park or Greeley Park, cheering on your favorite team at Holman Stadium, or finding serenity in the tranquil oasis of Mines Fall Park, every moment promises to immerse you in the dynamic essence of the City. Please note, the Landlord is seeking non-smoking tenants, and unfortunately, no pets or rental vouchers will be considered. Seize the opportunity to call this remarkable space your new home, available for immediate occupancy!
| Date | Buyer | Sale Price | Title Company |
|---|---|---|---|
| Chicklis Ian B | $325,000 | -- |
| Date | Status | Borrower | Loan Amount |
|---|---|---|---|
| Open | Chicklis Ian B | $1,190,000 | |
| Closed | Chicklis Ian B | $262,700 | |
| Closed | Chicklis Ian B | $304,000 | |
| Closed | Chicklis Ian B | $260,000 |
| Date | Event | Price | Change | Sq Ft Price |
|---|---|---|---|---|
| 06/04/2024 06/04/24 | Rented | $1,500 | 0.0% | -- |
| 05/14/2024 05/14/24 | Under Contract | -- | -- | -- |
| 05/06/2024 05/06/24 | For Rent | $1,500 | -- | -- |
| Year | Tax Paid | Tax Assessment Tax Assessment Total Assessment is a certain percentage of the fair market value that is determined by local assessors to be the total taxable value of land and additions on the property. | Land | Improvement |
|---|---|---|---|---|
| 2023 | $7,476 | $410,100 | $111,500 | $298,600 |
| 2022 | $7,411 | $410,100 | $111,500 | $298,600 |
| 2021 | $6,086 | $262,100 | $70,600 | $191,500 |
| 2020 | $5,926 | $262,100 | $70,600 | $191,500 |
| 2019 | $5,703 | $262,100 | $70,600 | $191,500 |
| 2018 | $5,559 | $262,100 | $70,600 | $191,500 |
| 2017 | $5,081 | $197,000 | $73,800 | $123,200 |
| 2016 | $4,939 | $197,000 | $73,800 | $123,200 |
| 2015 | $4,832 | $197,000 | $73,800 | $123,200 |
| 2014 | $4,738 | $197,000 | $73,800 | $123,200 |
Seller's Agent in 2024
John Roy
Galactic Realty Group LLC
(603) 625-2468
1 in this area
73 Total Sales