8 Maynard St San Francisco, CA 94112
Excelsior NeighborhoodEstimated Value: $1,029,000 - $1,290,000
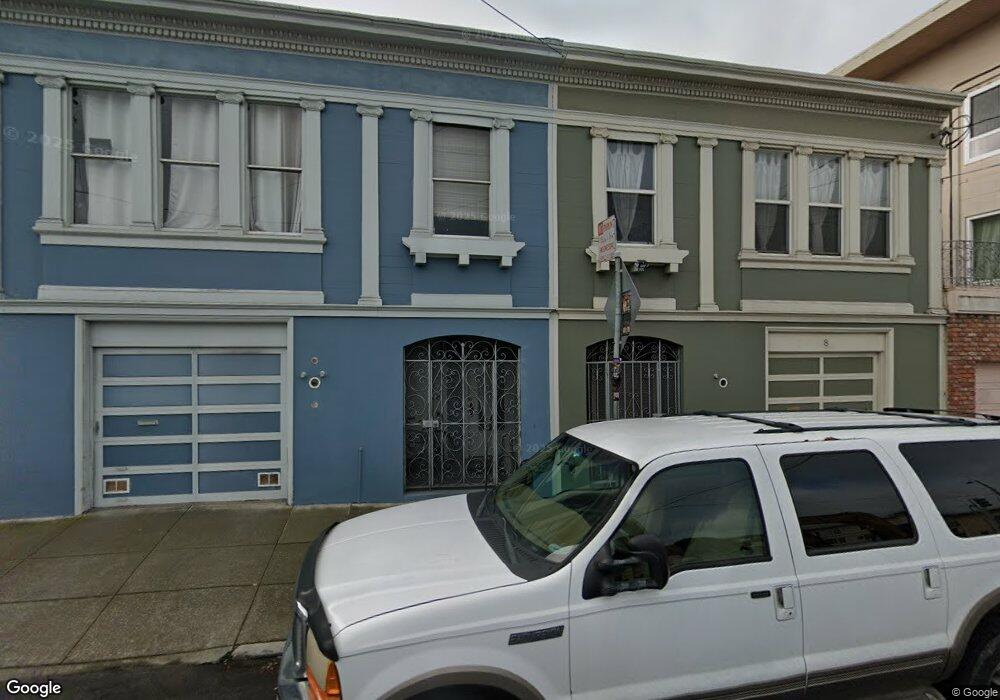
About This Home
This home is located at 8 Maynard St, San Francisco, CA 94112 and is currently estimated at $1,147,498, approximately $740 per square foot. 8 Maynard St is a home located in San Francisco County with nearby schools including Hillcrest Elementary School, King Jr. (Martin Luther) Academic Middle School, and Cornerstone Academy-Silver Campus.
Ownership History
Purchase Details
Purchase Details
Purchase Details
Home Financials for this Owner
Home Financials are based on the most recent Mortgage that was taken out on this home.Home Values in the Area
Average Home Value in this Area
Purchase History
We collect this data history from publicly available records. To have your information removed, we recommend requesting removal directly through your county’s website.
| Date | Buyer | Sale Price | Title Company |
|---|---|---|---|
| To Sylvia Lien T | -- | None Available | |
| To Sylvia Lien T | -- | -- | |
| To Sylvia Lien T | -- | Chicago Title Co |
Mortgage History
We collect this data history from publicly available records. To have your information removed, we recommend requesting removal directly through your county’s website.
| Date | Status | Borrower | Loan Amount |
|---|---|---|---|
| Closed | To Sylvia Lien T | $275,000 |
Tax History
| Year | Tax Paid | Tax Assessment Tax Assessment Total Assessment is a certain percentage of the fair market value that is determined by local assessors to be the total taxable value of land and additions on the property. | Land | Improvement |
|---|---|---|---|---|
| 2025 | $6,095 | $469,114 | $183,963 | $285,151 |
| 2024 | $6,095 | $459,916 | $180,356 | $279,560 |
| 2023 | $5,994 | $450,899 | $176,820 | $274,079 |
| 2022 | $5,865 | $442,058 | $173,353 | $268,705 |
| 2021 | $5,756 | $433,391 | $169,954 | $263,437 |
| 2020 | $5,797 | $428,948 | $168,212 | $260,736 |
| 2019 | $5,601 | $420,538 | $164,914 | $255,624 |
| 2018 | $5,412 | $412,293 | $161,681 | $250,612 |
| 2017 | $5,048 | $404,210 | $158,511 | $245,699 |
| 2016 | $4,942 | $396,285 | $155,403 | $240,882 |
| 2015 | $4,879 | $390,333 | $153,069 | $237,264 |
| 2014 | $4,750 | $382,688 | $150,071 | $232,617 |
Map
Ask me questions while you tour the home.