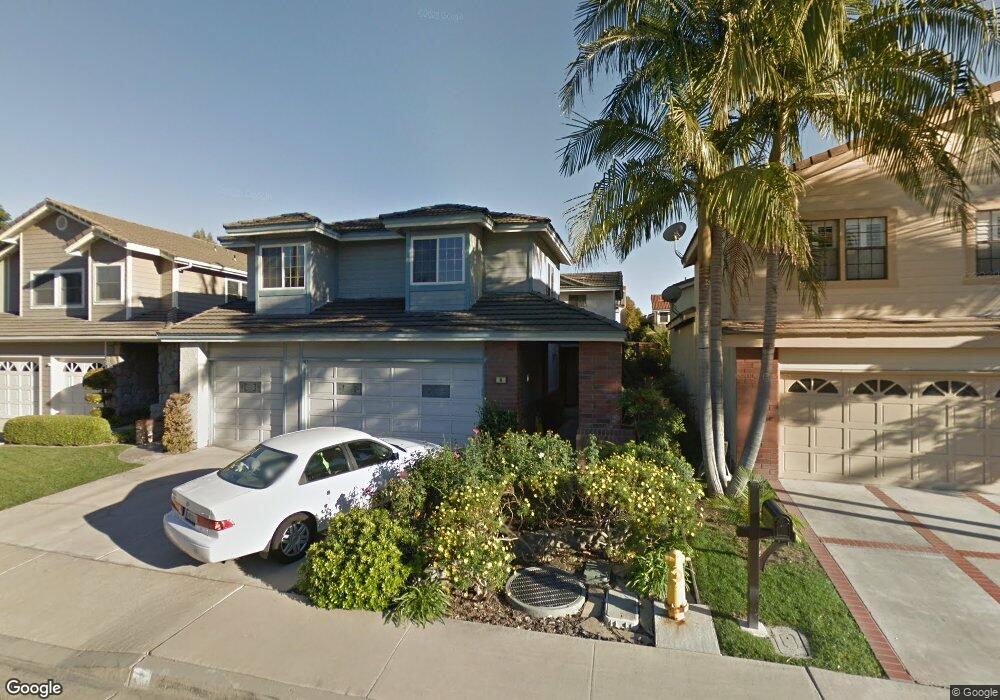
8 Merrimac Irvine, CA 92620
Northwood NeighborhoodEstimated Value: $2,009,000 - $2,108,000
4
Beds
3
Baths
3,115
Sq Ft
$662/Sq Ft
Est. Value
About This Home
This home is located at 8 Merrimac, Irvine, CA 92620 and is currently estimated at $2,062,053, approximately $661 per square foot. 8 Merrimac is a home located in Orange County with nearby schools including Brywood Elementary School, Sierra Vista Middle School, and Northwood High School.
Ownership History
Date
Name
Owned For
Owner Type
Purchase Details
Closed on
May 23, 2013
Sold by
Paulson Jason and Ho Tracy T
Bought by
Paulson Jason and Ho Paulson Tracy
Current Estimated Value
Home Financials for this Owner
Home Financials are based on the most recent Mortgage that was taken out on this home.
Original Mortgage
$620,000
Outstanding Balance
$437,358
Interest Rate
3.38%
Mortgage Type
New Conventional
Estimated Equity
$1,624,695
Purchase Details
Closed on
Mar 21, 2005
Sold by
Rotter Jim H and Rotter Susan L
Bought by
Paulson Jason and Ho Tracy T
Home Financials for this Owner
Home Financials are based on the most recent Mortgage that was taken out on this home.
Original Mortgage
$720,000
Interest Rate
4.39%
Mortgage Type
Negative Amortization
Create a Home Valuation Report for This Property
The Home Valuation Report is an in-depth analysis detailing your home's value as well as a comparison with similar homes in the area
Home Values in the Area
Average Home Value in this Area
Purchase History
| Date | Buyer | Sale Price | Title Company |
|---|---|---|---|
| Paulson Jason | -- | First American Title Company | |
| Paulson Jason | $900,000 | Ticor Title Company |
Source: Public Records
Mortgage History
| Date | Status | Borrower | Loan Amount |
|---|---|---|---|
| Open | Paulson Jason | $620,000 | |
| Closed | Paulson Jason | $720,000 |
Source: Public Records
Tax History Compared to Growth
Tax History
| Year | Tax Paid | Tax Assessment Tax Assessment Total Assessment is a certain percentage of the fair market value that is determined by local assessors to be the total taxable value of land and additions on the property. | Land | Improvement |
|---|---|---|---|---|
| 2025 | $12,815 | $1,249,153 | $852,321 | $396,832 |
| 2024 | $12,815 | $1,224,660 | $835,609 | $389,051 |
| 2023 | $12,483 | $1,200,648 | $819,225 | $381,423 |
| 2022 | $12,251 | $1,177,106 | $803,161 | $373,945 |
| 2021 | $11,973 | $1,154,026 | $787,413 | $366,613 |
| 2020 | $11,906 | $1,142,193 | $779,339 | $362,854 |
| 2019 | $11,641 | $1,119,798 | $764,058 | $355,740 |
| 2018 | $11,438 | $1,097,842 | $749,077 | $348,765 |
| 2017 | $11,201 | $1,076,316 | $734,389 | $341,927 |
| 2016 | $10,699 | $1,055,212 | $719,989 | $335,223 |
| 2015 | $10,203 | $1,006,000 | $709,883 | $296,117 |
| 2014 | $9,257 | $911,835 | $615,718 | $296,117 |
Source: Public Records
Map
Nearby Homes