
8 N 8th St Newark, OH 43055
Estimated payment $753/month
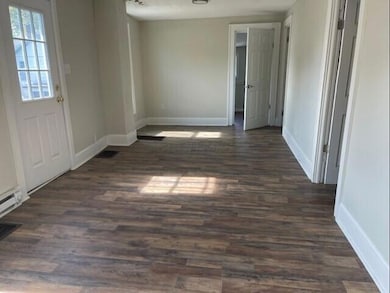
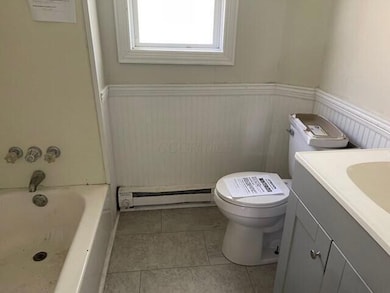
About This Home
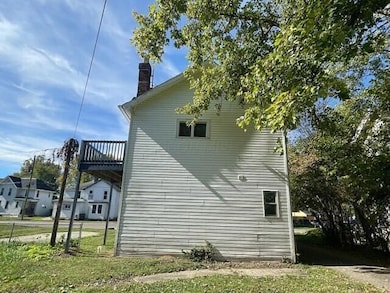
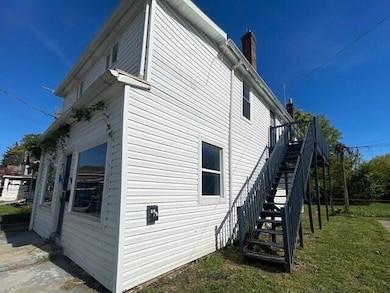
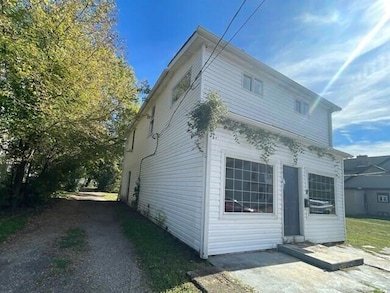
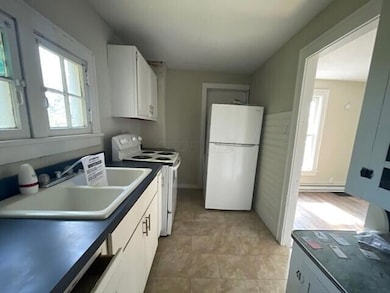
2 unit building with 1 unit up and 1 unit down.
2 bedrooms and 1 bath each. The upstairs unit has an additional flex room in the front. on the building. Call your Realtor for a viewing of this potnetial income producing property.
Property Details
Home Type
- Multi-Family
Est. Annual Taxes
- $1,134
Year Built
- Built in 1920
Lot Details
- 2,178 Sq Ft Lot
Home Design
- 1,680 Sq Ft Home
- Duplex
- Vinyl Siding
Parking
- 2 Parking Spaces
- No Garage
Utilities
- No Cooling
- Forced Air Heating System
- Heating System Uses Gas
Additional Features
- Basement
Community Details
- 2 Units
Listing and Financial Details
- Assessor Parcel Number 054-246804-00.000
Map
Home Values in the Area
Average Home Value in this Area
Tax History
| Year | Tax Paid | Tax Assessment Tax Assessment Total Assessment is a certain percentage of the fair market value that is determined by local assessors to be the total taxable value of land and additions on the property. | Land | Improvement |
|---|---|---|---|---|
| 2024 | $1,134 | $30,950 | $3,540 | $27,410 |
| 2023 | $4,059 | $30,950 | $3,540 | $27,410 |
| 2022 | $636 | $13,300 | $4,410 | $8,890 |
| 2021 | $670 | $13,300 | $4,410 | $8,890 |
| 2020 | $682 | $13,300 | $4,410 | $8,890 |
| 2019 | $686 | $13,300 | $4,410 | $8,890 |
| 2018 | $877 | $0 | $0 | $0 |
| 2017 | $656 | $0 | $0 | $0 |
| 2016 | $1,007 | $0 | $0 | $0 |
| 2015 | $830 | $0 | $0 | $0 |
| 2014 | $477 | $0 | $0 | $0 |
| 2013 | $2,008 | $0 | $0 | $0 |
Property History
| Date | Event | Price | List to Sale | Price per Sq Ft |
|---|---|---|---|---|
| 10/27/2025 10/27/25 | For Sale | $124,900 | -- | $74 / Sq Ft |
Purchase History
| Date | Type | Sale Price | Title Company |
|---|---|---|---|
| Sheriffs Deed | $129,300 | None Listed On Document | |
| Warranty Deed | -- | -- | |
| Warranty Deed | $45,000 | None Available | |
| Deed | $45,000 | -- |
Mortgage History
| Date | Status | Loan Amount | Loan Type |
|---|---|---|---|
| Previous Owner | $91,865 | Construction |
Source: Columbus and Central Ohio Regional MLS
MLS Number: 225040747
APN: 054-246804-00.000
Disclaimer: Certain information contained herein is derived from information provided by parties other than Homes.com. All information provided is deemed reliable, but is not guaranteed to be accurate and should be independently verified.
![]() IDX information is provided exclusively for personal, non-commercial use, and may not be used for any purpose other than to identify prospective properties consumers may be interested in purchasing.
IDX information is provided exclusively for personal, non-commercial use, and may not be used for any purpose other than to identify prospective properties consumers may be interested in purchasing.
Information is deemed reliable but not guaranteed.
- 11 Jefferson St
- 19 W Church St Unit 17-B
- 100 Chestnut St
- 43 N 3rd St Unit B
- 222 N 5th St Unit 222 N 5th St
- 41 Bowers Ave
- 119 Maholm St
- 119 Maholm St
- 140 Neal Ave Unit 1-2
- 233 S Pine St
- 425 Mount Vernon Rd
- 273 Union St
- 65 E Stevens St Unit 65
- 524 Jefferson Rd Unit 524 Jefferson Rd.
- 582 Moull St Unit Condo
- 929 Storybook Ln Unit 929 Story Book Lane
- 88 Penney Ave Unit 88
- 86 Penney Ave Unit 86 and half
- 487 Catalina Dr Unit C-5
- 712 Moull St
