8 Panoramic Place Berkeley, CA 94704
Estimated Value: $1,080,000 - $1,948,000
4
Beds
4
Baths
2,412
Sq Ft
$628/Sq Ft
Est. Value
About This Home
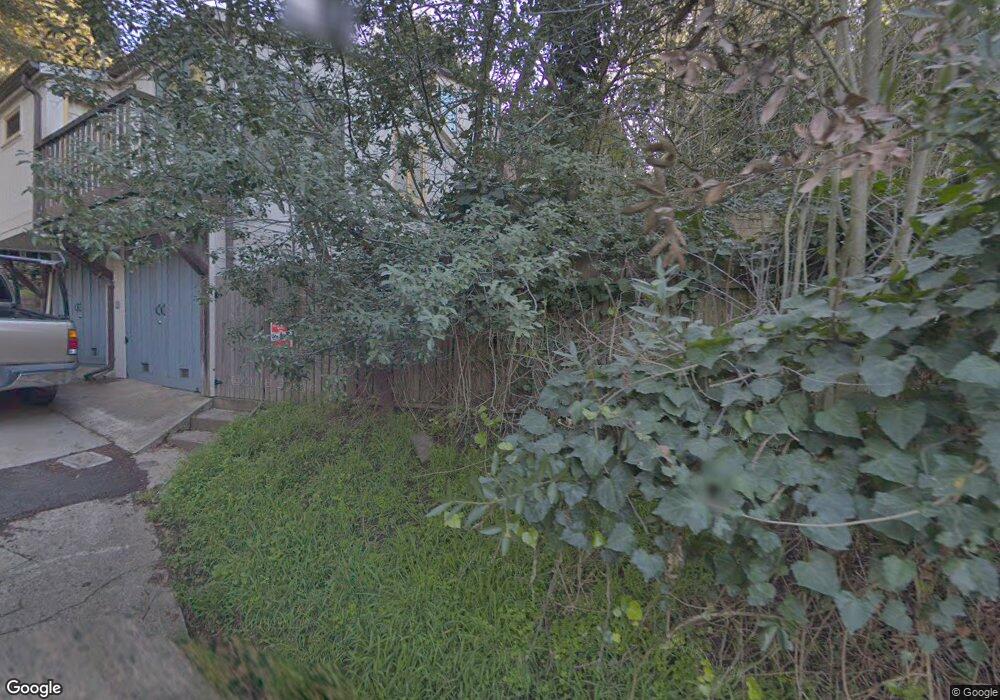
This home is located at 8 Panoramic Place, Berkeley, CA 94704 and is currently estimated at $1,514,000, approximately $627 per square foot. 8 Panoramic Place is a home located in Alameda County with nearby schools including Emerson Elementary School, John Muir Elementary School, and Malcolm X Elementary School.
Ownership History
Date
Name
Owned For
Owner Type
Purchase Details
Closed on
Mar 23, 2021
Sold by
Buechl Georg and Bade Sarah
Bought by
Buechl Georg and Georg Buechl
Current Estimated Value
Home Financials for this Owner
Home Financials are based on the most recent Mortgage that was taken out on this home.
Original Mortgage
$443,000
Outstanding Balance
$397,788
Interest Rate
2.8%
Mortgage Type
New Conventional
Estimated Equity
$1,116,212
Purchase Details
Closed on
Feb 6, 2006
Sold by
Christenson Mary and F E Mckinnon Revocable Living
Bought by
Buechi Georg and Bade Sarah
Home Financials for this Owner
Home Financials are based on the most recent Mortgage that was taken out on this home.
Original Mortgage
$468,750
Interest Rate
6.16%
Mortgage Type
Commercial
Purchase Details
Closed on
Feb 29, 2000
Sold by
Mckinnon Frances E
Bought by
Mckinnon F E and The F E Mckinnon Revocable Liv
Create a Home Valuation Report for This Property
The Home Valuation Report is an in-depth analysis detailing your home's value as well as a comparison with similar homes in the area
Purchase History
| Date | Buyer | Sale Price | Title Company |
|---|---|---|---|
| Buechl Georg | -- | First American Title Company | |
| Buechi Georg | $625,000 | Financial Title Company | |
| Mckinnon F E | -- | -- |
Source: Public Records
Mortgage History
| Date | Status | Borrower | Loan Amount |
|---|---|---|---|
| Open | Buechl Georg | $443,000 | |
| Closed | Buechi Georg | $468,750 |
Source: Public Records
Tax History
| Year | Tax Paid | Tax Assessment Tax Assessment Total Assessment is a certain percentage of the fair market value that is determined by local assessors to be the total taxable value of land and additions on the property. | Land | Improvement |
|---|---|---|---|---|
| 2025 | $12,093 | $703,299 | $150,310 | $559,989 |
| 2024 | $12,093 | $689,374 | $147,363 | $549,011 |
| 2023 | $11,825 | $682,724 | $144,475 | $538,249 |
| 2022 | $11,580 | $662,339 | $141,642 | $527,697 |
| 2021 | $11,583 | $649,219 | $138,866 | $517,353 |
| 2020 | $10,897 | $649,492 | $137,442 | $512,050 |
| 2019 | $10,395 | $636,762 | $134,748 | $502,014 |
| 2018 | $10,287 | $624,281 | $132,107 | $492,174 |
| 2017 | $9,904 | $612,044 | $129,518 | $482,526 |
| 2016 | $9,542 | $600,047 | $126,979 | $473,068 |
| 2015 | $9,408 | $591,039 | $125,073 | $465,966 |
| 2014 | $9,454 | $579,463 | $122,623 | $456,840 |
Source: Public Records
Map
Nearby Homes
- 161 Panoramic Way
- 39 Canyon Rd
- 3382 Dwight Way
- 2 Panoramic Way Unit 105
- 2 Panoramic Way Unit 304
- 0 Panoramic Way Unit 41118724
- 2611 Piedmont Ave Unit 4
- 2632 Warring St Unit 3
- 2601 College Ave Unit 203
- 2601 College Ave Unit 208
- 190 Stonewall Rd
- 2817 Palm Ct
- 2509 Dwight Way
- 7723 Claremont Ave
- 2700 Le Conte Ave Unit 301
- 2700 Le Conte Ave Unit 402
- 2643 Stuart St
- 2 Gravatt Dr
- 0 Gravatt Dr Unit 41122154
- 2535 Chilton Way
- 8 Panoramic Place
- 8 Panoramic Place
- 8 Panoramic Place
- 335 Panoramic Way
- 301 Panoramic Way
- 337 Panoramic Way
- 339 Panoramic Way
- 837 Panoramic Place
- 303 Panoramic Way
- 846 Panoramic Place
- 363 Panoramic Way
- 0 Panoramic Place
- 0 Panoramic Place Unit 41082095
- 0 Panoramic Place Unit 41075489
- 0 Panoramic Place Unit 41053996
- 0 Panoramic Place Unit 41032621
- 0 Panoramic Place Unit 41022047
- 0 Panoramic Place Unit 41020680
- 0 Panoramic Place Unit 41019882
- 0 Panoramic Place Unit 41014329
Your Personal Tour Guide
Ask me questions while you tour the home.