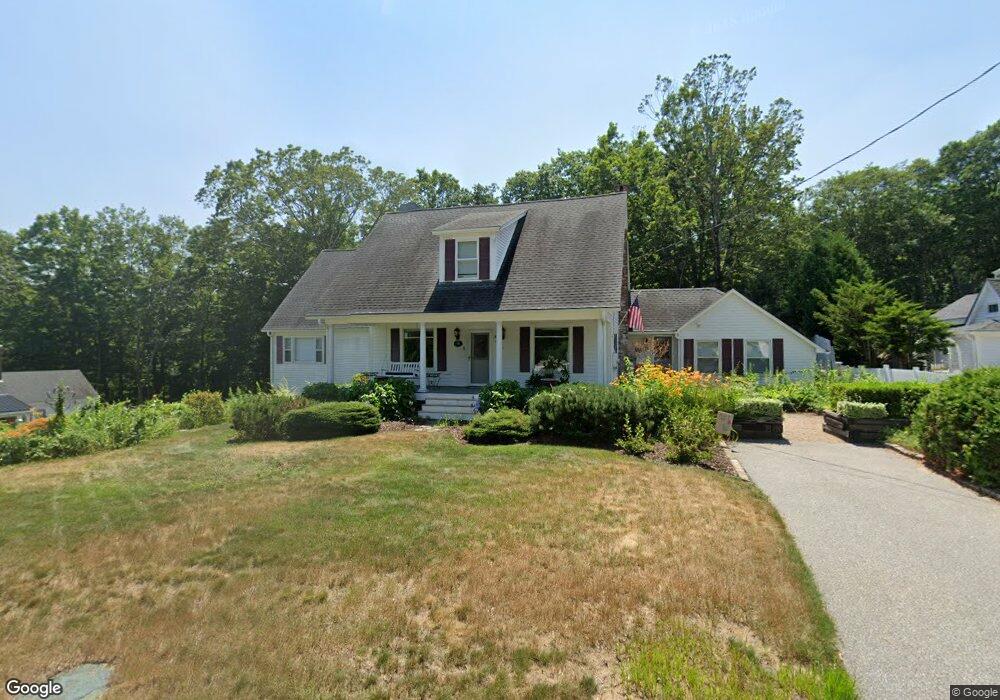
8 Red Gate Ln Meredith, NH 03253
Estimated Value: $706,232 - $1,069,000
3
Beds
3
Baths
3,100
Sq Ft
$268/Sq Ft
Est. Value
About This Home
This home is located at 8 Red Gate Ln, Meredith, NH 03253 and is currently estimated at $830,058, approximately $267 per square foot. 8 Red Gate Ln is a home located in Belknap County with nearby schools including Inter-Lakes Elementary School, Sandwich Central School, and Inter-Lakes Middle High School.
Ownership History
Date
Name
Owned For
Owner Type
Purchase Details
Closed on
May 7, 2010
Sold by
Quinney Peter D and Quinney Sandra L
Bought by
Richard F Werkowski Lt
Current Estimated Value
Home Financials for this Owner
Home Financials are based on the most recent Mortgage that was taken out on this home.
Original Mortgage
$214,000
Interest Rate
5.03%
Mortgage Type
Purchase Money Mortgage
Create a Home Valuation Report for This Property
The Home Valuation Report is an in-depth analysis detailing your home's value as well as a comparison with similar homes in the area
Home Values in the Area
Average Home Value in this Area
Purchase History
| Date | Buyer | Sale Price | Title Company |
|---|---|---|---|
| Richard F Werkowski Lt | $267,500 | -- |
Source: Public Records
Mortgage History
| Date | Status | Borrower | Loan Amount |
|---|---|---|---|
| Open | Richard F Werkowski Lt | $60,000 | |
| Open | Richard F Werkowski Lt | $208,000 | |
| Closed | Richard F Werkowski Lt | $214,000 |
Source: Public Records
Tax History
| Year | Tax Paid | Tax Assessment Tax Assessment Total Assessment is a certain percentage of the fair market value that is determined by local assessors to be the total taxable value of land and additions on the property. | Land | Improvement |
|---|---|---|---|---|
| 2024 | $4,764 | $464,300 | $167,900 | $296,400 |
| 2023 | $4,592 | $464,300 | $167,900 | $296,400 |
| 2022 | $4,367 | $312,600 | $91,500 | $221,100 |
| 2021 | $4,198 | $312,600 | $91,500 | $221,100 |
| 2020 | $0 | $312,600 | $91,500 | $221,100 |
| 2019 | $4,057 | $255,300 | $58,000 | $197,300 |
| 2018 | $3,988 | $255,300 | $58,000 | $197,300 |
| 2016 | $4,024 | $258,100 | $69,900 | $188,200 |
| 2015 | $3,923 | $258,100 | $69,900 | $188,200 |
| 2014 | $3,828 | $258,100 | $69,900 | $188,200 |
| 2013 | $3,719 | $258,100 | $69,900 | $188,200 |
Source: Public Records
Map
Nearby Homes
- 2 Waukewan Ave
- 27 Stevens Ave Unit D
- 21 Upper Ladd Hill Rd Unit D
- 21 Upper Ladd Hill Rd Unit A
- 21 Upper Ladd Hill Rd Unit E
- 21 Upper Ladd Hill Rd Unit C
- 21 Upper Ladd Hill Rd Unit B
- 21 Barnard Ridge Rd
- 53 Oak Knoll Rd
- 20 True Rd Unit 85
- 20 True Rd Unit 52
- 20 True Rd Unit 101
- 20 True Rd Unit 22
- 20 True Rd Unit 73
- 20 True Rd Unit 94
- 20 True Rd Unit 93
- 34-35-36 Commerce Ct
- 455 Daniel Webster Hwy
- 47 Clover Ridge Rd
- 2 Namak Way
Your Personal Tour Guide
Ask me questions while you tour the home.