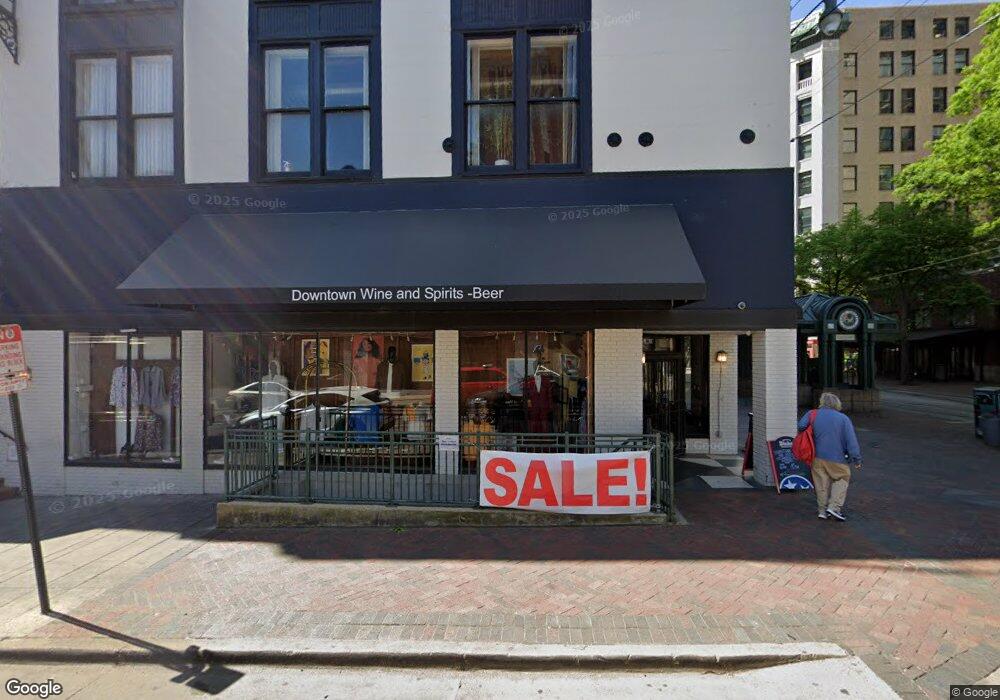
8 S Main St Unit 201 Memphis, TN 38103
Downtown Memphis NeighborhoodEstimated Value: $244,000 - $304,000
1
Bed
2
Baths
1,593
Sq Ft
$168/Sq Ft
Est. Value
About This Home
This home is located at 8 S Main St Unit 201, Memphis, TN 38103 and is currently estimated at $267,333, approximately $167 per square foot. 8 S Main St Unit 201 is a home located in Shelby County with nearby schools including Downtown Elementary School, Booker T. Washington Middle & High School, and Manassas High School.
Ownership History
Date
Name
Owned For
Owner Type
Purchase Details
Closed on
Sep 15, 2021
Sold by
Landmark Commerical Llc
Bought by
The Rowand Group Llc
Current Estimated Value
Purchase Details
Closed on
Jul 14, 2021
Sold by
Reddy Praveen
Bought by
Landmark Commerical Llc
Purchase Details
Closed on
Apr 3, 2021
Sold by
Yakkala Harish
Bought by
Reddy Praveen
Purchase Details
Closed on
Nov 26, 2019
Sold by
Landmark Commercial Llc
Bought by
Yakkala Harrish
Purchase Details
Closed on
Oct 19, 2017
Sold by
Graham Walker W and Humphreys Gwendolyn Tabb Graham
Bought by
Landmark Commerical Llc
Purchase Details
Closed on
Dec 29, 2015
Sold by
Graham Walker W
Bought by
Revocabl Gwendolyn Tabb Graham Humphreys
Purchase Details
Closed on
May 12, 2015
Sold by
Memphis Center City Revenue Finance Corp
Bought by
8 S Main Llc
Create a Home Valuation Report for This Property
The Home Valuation Report is an in-depth analysis detailing your home's value as well as a comparison with similar homes in the area
Home Values in the Area
Average Home Value in this Area
Purchase History
| Date | Buyer | Sale Price | Title Company |
|---|---|---|---|
| The Rowand Group Llc | $1,200,000 | None Available | |
| Landmark Commerical Llc | -- | None Available | |
| Reddy Praveen | -- | None Available | |
| Yakkala Harrish | -- | None Available | |
| Landmark Commerical Llc | -- | None Available | |
| Revocabl Gwendolyn Tabb Graham Humphreys | -- | Attorney | |
| 8 S Main Llc | $1,000 | None Available |
Source: Public Records
Tax History Compared to Growth
Tax History
| Year | Tax Paid | Tax Assessment Tax Assessment Total Assessment is a certain percentage of the fair market value that is determined by local assessors to be the total taxable value of land and additions on the property. | Land | Improvement |
|---|---|---|---|---|
| 2025 | $2,563 | $90,920 | $4,200 | $86,720 |
| 2024 | $2,563 | $75,600 | $4,200 | $71,400 |
| 2023 | $4,605 | $75,600 | $4,200 | $71,400 |
| 2022 | $4,605 | $75,600 | $4,200 | $71,400 |
| 2021 | $2,912 | $47,250 | $2,625 | $44,625 |
| 2020 | $2,886 | $39,825 | $2,625 | $37,200 |
| 2019 | $4,617 | $63,720 | $4,200 | $59,520 |
| 2018 | $4,966 | $63,720 | $4,200 | $59,520 |
| 2017 | $1,637 | $39,825 | $2,625 | $37,200 |
| 2016 | $1,853 | $42,400 | $0 | $0 |
| 2014 | $300 | $0 | $0 | $0 |
Source: Public Records
Map
Nearby Homes
- 107 Madison Ave Unit 401
- 127 Madison Ave Unit 602
- 127 Madison Ave Unit 701
- 0 N 2nd St
- 66 Monroe Ave
- 66 Monroe Ave Unit 606
- 66 Monroe Ave Unit 301
- 66 Monroe Ave Unit 805
- 66 Monroe Ave Unit 1004
- 66 Monroe Ave Unit RG1-3
- 18 N 2nd St
- 66 S Front St Unit 23
- 95 S Main St Unit 101
- 95 S Main St Unit 102
- 95 S Main St Unit 204
- 0 S 3rd St
- 71 Union Ave Unit 102
- 92 S Main St Unit 307
- 92 S Main St Unit 103
- 92 S Main St Unit 202
- 8 S Main St
- 8 S Main St Unit COS
- 8 S Main St Unit 401
- 8 S Main St Unit 301
- 8 S Main St Unit 101
- 6 S Main St
- 10 S Main St
- 107 Madison Ave Unit 201
- 107 Madison Ave Unit 301
- 107 Madison Ave Unit 102
- 107 Madison Ave Unit 101
- 107 Madison Ave Unit B01
- 109 Madison Ave
- 0 S Main St
- 113 Madison Ave
- 18 S Main St
- 111 Madison Ave
- 1 S Main St
- 22 S Main St
- 24 S Main St