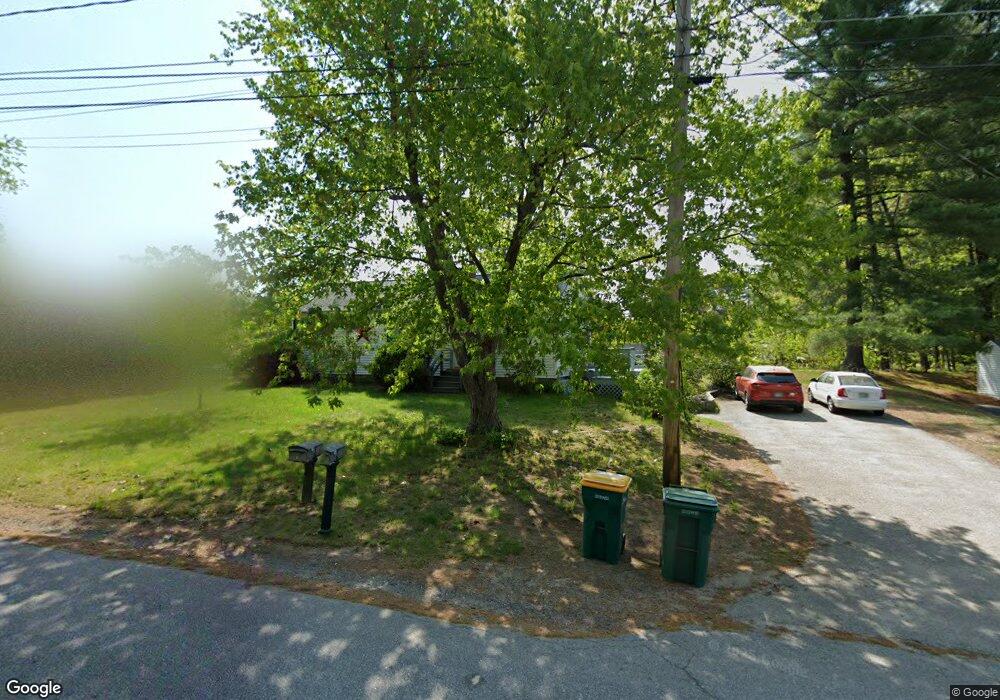
8 Sewell Rd Rochester, NH 03868
Estimated Value: $308,000 - $331,234
3
Beds
1
Bath
936
Sq Ft
$345/Sq Ft
Est. Value
About This Home
This home is located at 8 Sewell Rd, Rochester, NH 03868 and is currently estimated at $322,809, approximately $344 per square foot. 8 Sewell Rd is a home located in Strafford County with nearby schools including East Rochester School, Nancy Loud School, and Rochester Middle School.
Ownership History
Date
Name
Owned For
Owner Type
Purchase Details
Closed on
Jul 17, 2006
Sold by
Hodsdon Richard R and Hodsdon Kellie M
Bought by
Boston Wayne H and Boston Jennifer L
Current Estimated Value
Home Financials for this Owner
Home Financials are based on the most recent Mortgage that was taken out on this home.
Original Mortgage
$171,950
Interest Rate
6.71%
Purchase Details
Closed on
Nov 22, 2002
Sold by
Demars Donald P and Demars Lisa J
Bought by
Chabot Arlene J
Home Financials for this Owner
Home Financials are based on the most recent Mortgage that was taken out on this home.
Original Mortgage
$132,905
Interest Rate
6.07%
Purchase Details
Closed on
Nov 20, 2000
Sold by
Horn Raymond H and Horn Irene E
Bought by
Demars Donald P and Demars Lisa J
Home Financials for this Owner
Home Financials are based on the most recent Mortgage that was taken out on this home.
Original Mortgage
$86,600
Interest Rate
7.78%
Create a Home Valuation Report for This Property
The Home Valuation Report is an in-depth analysis detailing your home's value as well as a comparison with similar homes in the area
Home Values in the Area
Average Home Value in this Area
Purchase History
| Date | Buyer | Sale Price | Title Company |
|---|---|---|---|
| Boston Wayne H | $181,000 | -- | |
| Boston Wayne H | $181,000 | -- | |
| Chabot Arlene J | $139,900 | -- | |
| Demars Donald P | $91,200 | -- |
Source: Public Records
Mortgage History
| Date | Status | Borrower | Loan Amount |
|---|---|---|---|
| Open | Demars Donald P | $161,500 | |
| Closed | Boston Wayne H | $171,950 | |
| Previous Owner | Demars Donald P | $132,905 | |
| Previous Owner | Demars Donald P | $86,600 |
Source: Public Records
Tax History Compared to Growth
Tax History
| Year | Tax Paid | Tax Assessment Tax Assessment Total Assessment is a certain percentage of the fair market value that is determined by local assessors to be the total taxable value of land and additions on the property. | Land | Improvement |
|---|---|---|---|---|
| 2024 | $3,871 | $260,700 | $77,200 | $183,500 |
| 2023 | $3,804 | $147,800 | $53,400 | $94,400 |
| 2022 | $3,736 | $147,800 | $53,400 | $94,400 |
| 2021 | $3,643 | $147,800 | $53,400 | $94,400 |
| 2020 | $3,640 | $147,900 | $53,400 | $94,500 |
| 2019 | $3,683 | $147,900 | $53,400 | $94,500 |
| 2018 | $3,724 | $137,100 | $40,100 | $97,000 |
| 2017 | $3,610 | $137,100 | $40,100 | $97,000 |
| 2016 | $3,383 | $119,700 | $40,100 | $79,600 |
| 2015 | $3,370 | $119,700 | $40,100 | $79,600 |
| 2014 | $3,288 | $119,700 | $40,100 | $79,600 |
| 2013 | $3,261 | $123,700 | $53,400 | $70,300 |
| 2012 | $3,177 | $123,700 | $53,400 | $70,300 |
Source: Public Records
Map
Nearby Homes
- 36 Melrose Dr
- 6 Gina Dr
- 30 Riverlawn Ave
- 47 Salmon Falls Rd
- 15 Friesian Ln
- 28 Joshua St
- 96 Salmon Falls Rd
- 31 Buffy St
- 30 Flat Rock Bridge Rd
- 13 Crosswind Ln
- 114b Betts Rd
- 52 Little Falls Bridge Rd
- 384 Cross Rd
- 180 Chestnut Hill Rd
- 41 Kinsale Dr
- 70 River Rd
- 13 Copps Dr
- 80 Woodland Green
- 15 Copps Dr
- 17 Copps Dr