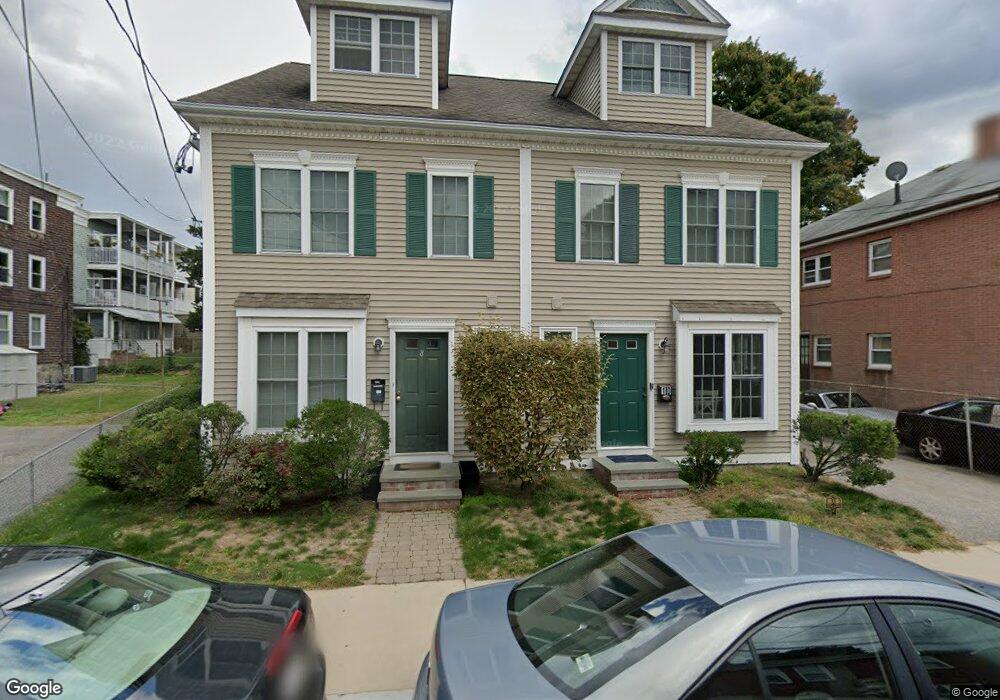
8 Shanley St Brighton, MA 02135
Saint Elizabeths NeighborhoodEstimated Value: $684,000 - $942,000
3
Beds
3
Baths
1,503
Sq Ft
$558/Sq Ft
Est. Value
About This Home
This home is located at 8 Shanley St, Brighton, MA 02135 and is currently estimated at $838,058, approximately $557 per square foot. 8 Shanley St is a home located in Suffolk County with nearby schools including Shaloh House Jewish Day School, St Columbkille Partnership School, and Mesivta High School of Greater Boston.
Ownership History
Date
Name
Owned For
Owner Type
Purchase Details
Closed on
Dec 28, 2024
Sold by
Hubert Gallagher 2015 T and Hubert Beranger
Bought by
Gallagher Ashley
Current Estimated Value
Purchase Details
Closed on
Jul 10, 2020
Sold by
Gallagher Hubert Est and Beranger
Bought by
Gallagher 2015 T H and Gallagher G
Purchase Details
Closed on
Sep 15, 1998
Sold by
Delacey Dorothy B
Bought by
Gallagher Hugh
Create a Home Valuation Report for This Property
The Home Valuation Report is an in-depth analysis detailing your home's value as well as a comparison with similar homes in the area
Home Values in the Area
Average Home Value in this Area
Purchase History
| Date | Buyer | Sale Price | Title Company |
|---|---|---|---|
| Gallagher Ashley | -- | None Available | |
| Gallagher Ashley | -- | None Available | |
| Gallagher 2015 T H | -- | None Available | |
| H Gallagher 2015 T | -- | None Available | |
| Gallagher 2015 T H | -- | None Available | |
| Gallagher Hugh | $87,000 | -- | |
| Gallagher Hugh | $87,000 | -- |
Source: Public Records
Tax History Compared to Growth
Tax History
| Year | Tax Paid | Tax Assessment Tax Assessment Total Assessment is a certain percentage of the fair market value that is determined by local assessors to be the total taxable value of land and additions on the property. | Land | Improvement |
|---|---|---|---|---|
| 2025 | $8,785 | $758,600 | $0 | $758,600 |
| 2024 | $7,034 | $645,300 | $0 | $645,300 |
| 2023 | $6,931 | $645,300 | $0 | $645,300 |
| 2022 | $6,624 | $608,800 | $0 | $608,800 |
| 2021 | $6,496 | $608,800 | $0 | $608,800 |
| 2020 | $7,002 | $663,100 | $0 | $663,100 |
| 2019 | $6,853 | $650,200 | $0 | $650,200 |
| 2018 | $6,371 | $607,900 | $0 | $607,900 |
| 2017 | $5,961 | $562,900 | $0 | $562,900 |
| 2016 | $5,680 | $516,400 | $0 | $516,400 |
| 2015 | $5,294 | $437,200 | $0 | $437,200 |
| 2014 | $4,997 | $397,200 | $0 | $397,200 |
Source: Public Records
Map
Nearby Homes
- 461 Washington St Unit 301
- 30 Dighton St Unit 3
- 30 Dighton St
- 18 Rushmore St Unit 18
- 77 Bennett St Unit 2
- 12 Mina Way
- 10 Mina Way
- 10 Waldo Terrace
- 8 Kenrick St Unit 10
- 23 Winship St Unit 2
- 6 Harriet St
- 56 Winship St Unit 302
- 300 Faneuil St
- 99 Chestnut Hill Ave Unit 212
- 33 Shannon St Unit 1
- 66 Union St
- 357 Faneuil St Unit 12
- 59 Union St Unit 59
- 21 Upcrest Rd
- 12-14 Shannon St Unit 3
- 10 Shanley St
- 8 Shanley St Unit 1
- 8 Shanley St Unit 8
- 10 Shanley St Unit 10
- 8 Shanley St
- 446 Washington St
- 446 Washington St Unit 3
- 16 Shanley St Unit 3
- 16 Shanley St Unit 3
- 16 Shanley St Unit 1
- 7 Shanley St Unit 2
- 7 Shanley St Unit 4
- 7 Shanley St Unit 1
- 71 Foster St
- 71 Foster St
- 71 Foster St Unit 1
- 71 Foster St Unit 3
- 71 Foster St Unit 2
- 444 Washington St Unit 303
- 444 Washington St Unit 371