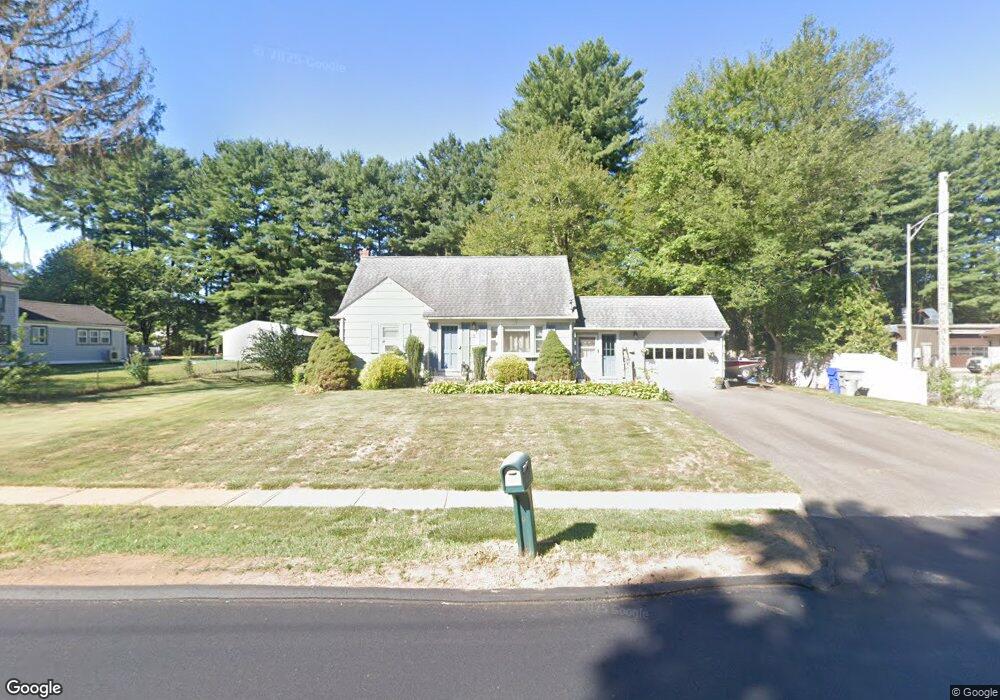
8 Simon Rd Enfield, CT 06082
Estimated Value: $316,000 - $351,000
4
Beds
2
Baths
1,224
Sq Ft
$271/Sq Ft
Est. Value
About This Home
This home is located at 8 Simon Rd, Enfield, CT 06082 and is currently estimated at $331,227, approximately $270 per square foot. 8 Simon Rd is a home located in Hartford County with nearby schools including Edgar H. Parkman School, Enfield Street Elementary School, and Enfield High School.
Ownership History
Date
Name
Owned For
Owner Type
Purchase Details
Closed on
May 6, 1999
Sold by
Nadeau Kevin and Nadeau Linda
Bought by
Doherty Steven
Current Estimated Value
Purchase Details
Closed on
Sep 28, 1995
Sold by
Windsor Locks S and Windsor L
Bought by
Nadeau Kevin and Nadeau Linda
Purchase Details
Closed on
Nov 18, 1988
Sold by
Neelans Victoria
Bought by
Saccente Carl
Create a Home Valuation Report for This Property
The Home Valuation Report is an in-depth analysis detailing your home's value as well as a comparison with similar homes in the area
Home Values in the Area
Average Home Value in this Area
Purchase History
| Date | Buyer | Sale Price | Title Company |
|---|---|---|---|
| Doherty Steven | $115,000 | -- | |
| Nadeau Kevin | $92,000 | -- | |
| Saccente Carl | $142,900 | -- |
Source: Public Records
Mortgage History
| Date | Status | Borrower | Loan Amount |
|---|---|---|---|
| Open | Saccente Carl | $163,614 | |
| Closed | Saccente Carl | $153,600 | |
| Closed | Saccente Carl | $114,500 |
Source: Public Records
Tax History
| Year | Tax Paid | Tax Assessment Tax Assessment Total Assessment is a certain percentage of the fair market value that is determined by local assessors to be the total taxable value of land and additions on the property. | Land | Improvement |
|---|---|---|---|---|
| 2025 | $5,367 | $153,400 | $58,500 | $94,900 |
| 2024 | $5,223 | $153,400 | $58,500 | $94,900 |
| 2023 | $5,185 | $153,400 | $58,500 | $94,900 |
| 2022 | $4,708 | $153,400 | $58,500 | $94,900 |
| 2021 | $4,557 | $121,430 | $48,430 | $73,000 |
| 2020 | $4,557 | $121,430 | $48,430 | $73,000 |
| 2019 | $4,569 | $121,430 | $48,430 | $73,000 |
| 2018 | $4,493 | $121,430 | $48,430 | $73,000 |
| 2017 | $4,242 | $121,430 | $48,430 | $73,000 |
| 2016 | $4,150 | $120,960 | $49,690 | $71,270 |
| 2015 | $4,021 | $120,960 | $49,690 | $71,270 |
| 2014 | $3,917 | $120,960 | $49,690 | $71,270 |
Source: Public Records
Map
Nearby Homes
Your Personal Tour Guide
Ask me questions while you tour the home.