Estimated Value: $563,000 - $667,000
3
Beds
2
Baths
2,351
Sq Ft
$268/Sq Ft
Est. Value
About This Home
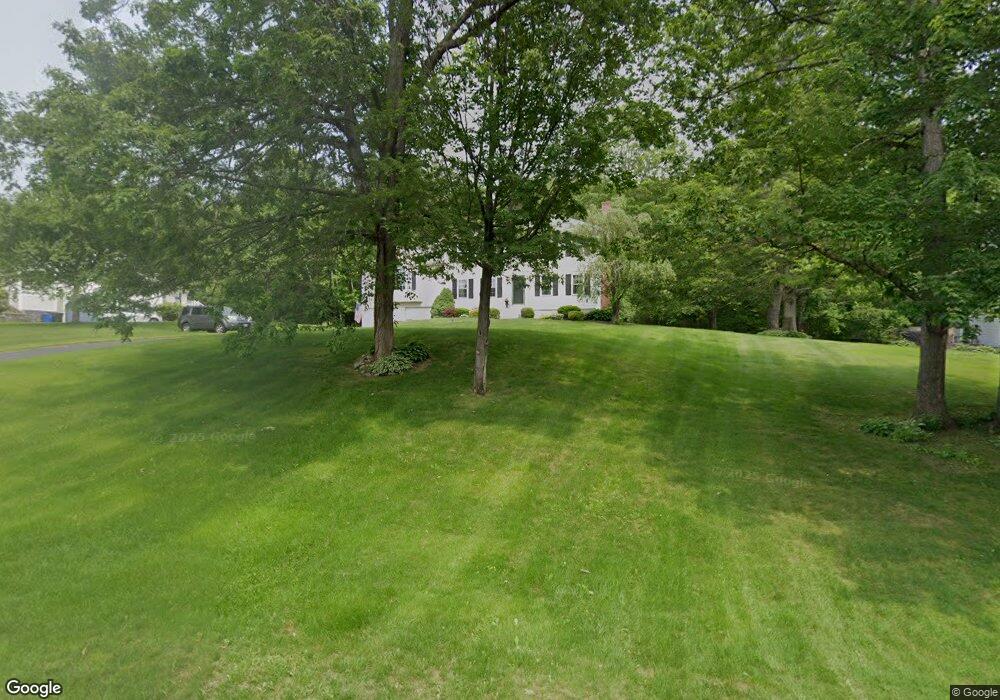
This home is located at 8 Squamscott Ave, Derry, NH 03038 and is currently estimated at $629,403, approximately $267 per square foot. 8 Squamscott Ave is a home located in Rockingham County with nearby schools including Derry Village School, West Running Brook Middle School, and Pinkerton Academy.
Ownership History
Date
Name
Owned For
Owner Type
Purchase Details
Closed on
Mar 21, 1997
Sold by
Harris Glen D and Harris Lisa M
Bought by
Marchman Lee F and Marchman Cheri N
Current Estimated Value
Home Financials for this Owner
Home Financials are based on the most recent Mortgage that was taken out on this home.
Original Mortgage
$120,500
Interest Rate
7.68%
Create a Home Valuation Report for This Property
The Home Valuation Report is an in-depth analysis detailing your home's value as well as a comparison with similar homes in the area
Home Values in the Area
Average Home Value in this Area
Purchase History
| Date | Buyer | Sale Price | Title Company |
|---|---|---|---|
| Marchman Lee F | $127,000 | -- |
Source: Public Records
Mortgage History
| Date | Status | Borrower | Loan Amount |
|---|---|---|---|
| Open | Marchman Lee F | $258,750 | |
| Closed | Marchman Lee F | $75,100 | |
| Closed | Marchman Lee F | $120,500 |
Source: Public Records
Tax History
| Year | Tax Paid | Tax Assessment Tax Assessment Total Assessment is a certain percentage of the fair market value that is determined by local assessors to be the total taxable value of land and additions on the property. | Land | Improvement |
|---|---|---|---|---|
| 2024 | $11,919 | $637,700 | $0 | $637,700 |
| 2023 | $11,535 | $557,800 | $0 | $557,800 |
| 2022 | $10,621 | $557,800 | $0 | $557,800 |
| 2021 | $10,469 | $422,800 | $0 | $422,800 |
| 2020 | $10,291 | $422,800 | $0 | $422,800 |
| 2019 | $8,779 | $336,100 | $86,000 | $250,100 |
| 2018 | $8,749 | $336,100 | $86,000 | $250,100 |
| 2017 | $9,440 | $327,100 | $86,000 | $241,100 |
| 2016 | $8,846 | $326,900 | $86,000 | $240,900 |
| 2015 | $8,459 | $289,400 | $86,000 | $203,400 |
| 2014 | $8,514 | $289,400 | $86,000 | $203,400 |
| 2013 | $8,351 | $265,200 | $86,000 | $179,200 |
Source: Public Records
Map
Nearby Homes
- 242 Rockingham Rd
- 13 Kilrea Rd Unit L
- 2 Kinsman Ln
- 26 Partridge Rd
- 43 Lampton Dr
- 46 Hadleigh Rd
- 3 Evergreen Way Unit End unit
- 71 Island Pond Rd
- 5 Craven Terrace
- 24 Rockingham Rd
- 48 Trails Edge Rd
- 45 Trails Edge Rd
- 2 Brown Rd
- 35 Steele Rd
- 343 Island Pond Rd
- 139 Rockingham Rd Unit 21
- 39 Overton Rd
- 71 Caddy Dr
- 65 Caddy Dr
- 84 Caddy Dr
- 10 Squamscott Ave
- 6 Squamscott Ave
- 12 Squamscott Ave
- 4 Squamscott Ave
- 7 Squamscott Ave
- 14 Squamscott Ave
- 3 Squamscott Ave
- 9 Squamscott Ave
- 5 Squamscott Ave
- 13 Pemigewasset Cir
- 11 Squamscott Ave
- 7 Pemigewasset Cir
- 11 Pemigewasset Cir
- 1 Squamscott Ave
- 16 Squamscott Ave
- 13 Squamscott Ave
- 9 Pemigewasset Cir
- 15 Pemigewasset Cir
- 4 Westview Dr
- 5 Pemigewasset Cir