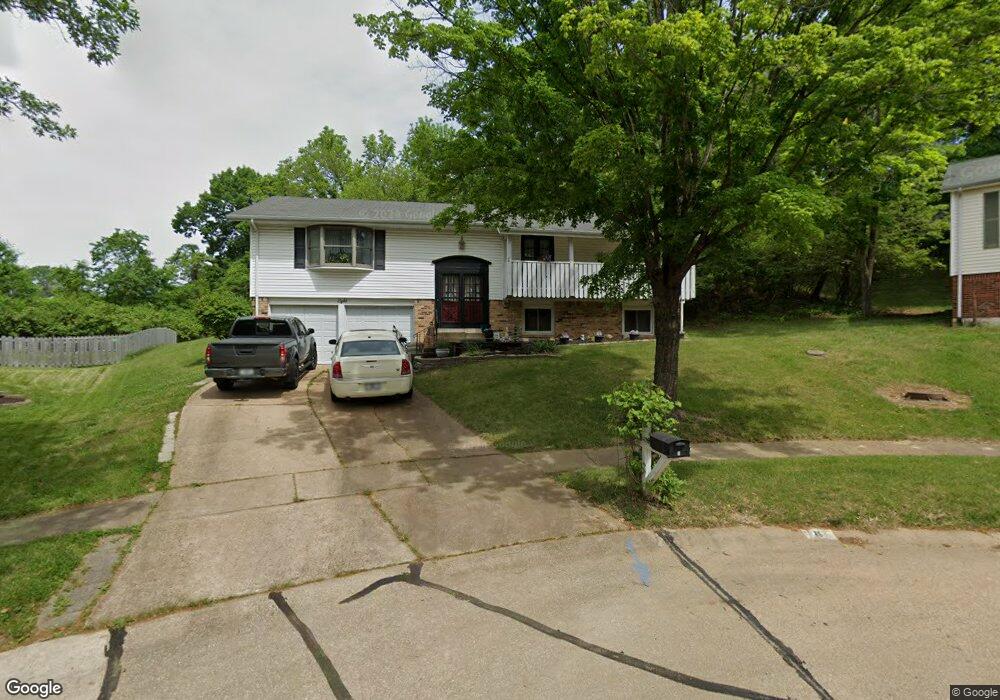
8 Tree Hill Ct Ballwin, MO 63021
Estimated Value: $327,260 - $422,000
4
Beds
3
Baths
1,456
Sq Ft
$260/Sq Ft
Est. Value
About This Home
This home is located at 8 Tree Hill Ct, Ballwin, MO 63021 and is currently estimated at $378,315, approximately $259 per square foot. 8 Tree Hill Ct is a home located in St. Louis County with nearby schools including Carman Trails Elementary School, Parkway South Middle School, and Parkway South High School.
Ownership History
Date
Name
Owned For
Owner Type
Purchase Details
Closed on
Nov 25, 2003
Sold by
Williams Annette and Bradford Annette
Bought by
Williams Annette
Current Estimated Value
Home Financials for this Owner
Home Financials are based on the most recent Mortgage that was taken out on this home.
Original Mortgage
$139,500
Interest Rate
6.01%
Mortgage Type
Stand Alone Refi Refinance Of Original Loan
Purchase Details
Closed on
Oct 2, 2003
Sold by
Williams Annette and Williams Derrick
Bought by
Williams Derrick and Williams Annette
Home Financials for this Owner
Home Financials are based on the most recent Mortgage that was taken out on this home.
Original Mortgage
$139,500
Interest Rate
6.01%
Mortgage Type
Stand Alone Refi Refinance Of Original Loan
Purchase Details
Closed on
Jan 23, 1998
Sold by
Bradford and Annette
Bought by
Bradford Annette
Create a Home Valuation Report for This Property
The Home Valuation Report is an in-depth analysis detailing your home's value as well as a comparison with similar homes in the area
Home Values in the Area
Average Home Value in this Area
Purchase History
| Date | Buyer | Sale Price | Title Company |
|---|---|---|---|
| Williams Annette | -- | -- | |
| Williams Derrick | -- | Title Searches Incorporated | |
| Bradford Annette | -- | -- |
Source: Public Records
Mortgage History
| Date | Status | Borrower | Loan Amount |
|---|---|---|---|
| Closed | Williams Annette | $139,500 | |
| Closed | Williams Derrick | $13,110 |
Source: Public Records
Tax History
| Year | Tax Paid | Tax Assessment Tax Assessment Total Assessment is a certain percentage of the fair market value that is determined by local assessors to be the total taxable value of land and additions on the property. | Land | Improvement |
|---|---|---|---|---|
| 2025 | $3,720 | $63,920 | $31,160 | $32,760 |
| 2024 | $3,720 | $54,250 | $27,270 | $26,980 |
| 2023 | $3,720 | $54,250 | $27,270 | $26,980 |
| 2022 | $3,562 | $47,320 | $27,270 | $20,050 |
| 2021 | $3,542 | $47,320 | $27,270 | $20,050 |
| 2020 | $3,425 | $43,800 | $19,250 | $24,550 |
| 2019 | $3,365 | $43,800 | $19,250 | $24,550 |
| 2018 | $3,374 | $40,740 | $14,480 | $26,260 |
| 2017 | $3,233 | $40,740 | $14,480 | $26,260 |
| 2016 | $2,996 | $35,070 | $11,590 | $23,480 |
| 2015 | $3,128 | $35,070 | $11,590 | $23,480 |
| 2014 | $2,540 | $31,610 | $11,510 | $20,100 |
Source: Public Records
Map
Nearby Homes
- 712 La Marite Dr
- 747 La Feil Dr
- 1602 Mauvering Ct
- 831 Windsor Gardens Ct
- 256 Glandore Dr Unit D
- 813 Pebblefield Terrace
- 759 Carman Woods Dr
- 221 Braeshire Dr Unit B
- 802 Delhurst Dr
- 308 Forest Parkway Dr
- 9 Lochhaven Ln
- 954 Barcroft Woods Ct
- 949 Barcroft Woods Ct
- 1649 Country Hill Ln
- 1559 Beacon Woods Ct
- 514 Meramec Station Rd
- 750 Burwick Terrace
- 952 Queensbridge Rd
- 1039 Treeline Ct
- 1069 Big Bend Crossing Dr
- 9 Tree Hill Ct
- 7 Treehill Ct
- 7 Tree Hill Ct
- 1432 Sunnytree Ln
- 1434 Sunnytree Ln
- 10 Tree Hill Ct
- 706 La Marite Dr
- 6 Tree Hill Ct
- 708 La Marite Dr
- 1436 Sunnytree Ln
- 1430 Sunnytree Ln
- 704 La Marite Dr
- 5 Tree Hill Ct
- 11 Tree Hill Ct
- 710 La Marite Dr
- 1438 Sunnytree Ln
- 702 La Marite Dr
- 4 Tree Hill Ct
- 1431 Sunnytree Ln
- 1428 Sunnytree Ln
Your Personal Tour Guide
Ask me questions while you tour the home.