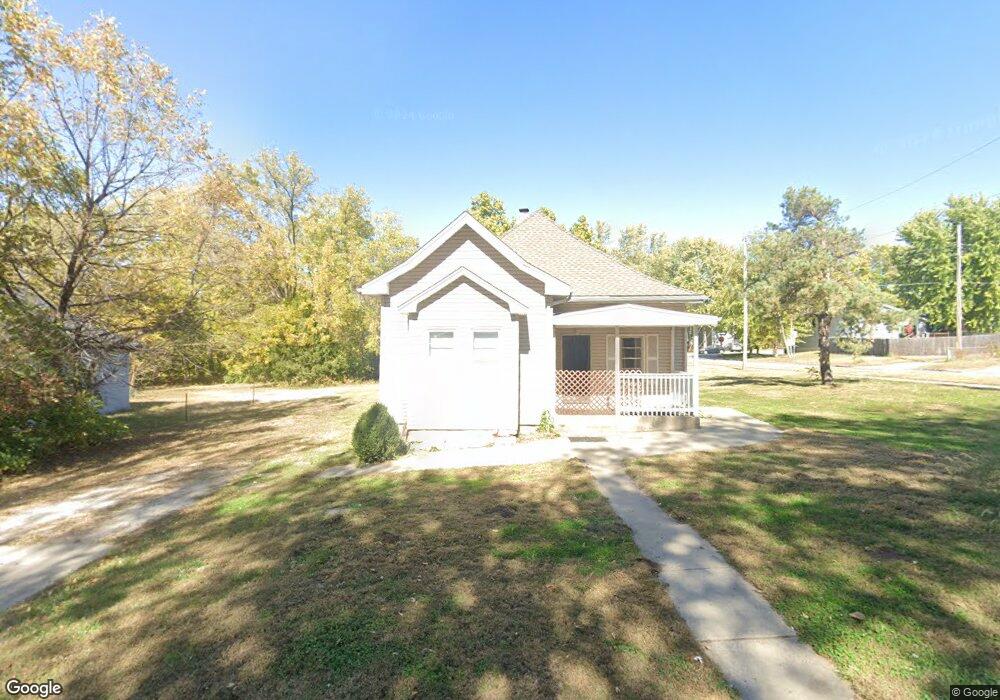
8 W Brown St Liberty, MO 64068
Estimated Value: $200,000 - $234,000
3
Beds
2
Baths
--
Sq Ft
10,454
Sq Ft Lot
About This Home
This home is located at 8 W Brown St, Liberty, MO 64068 and is currently estimated at $218,399. 8 W Brown St is a home located in Clay County with nearby schools including Ridgeview Elementary School, Heritage Middle School, and Liberty North High School.
Ownership History
Date
Name
Owned For
Owner Type
Purchase Details
Closed on
Oct 28, 2021
Sold by
Magel Matthew and Magel Matty
Bought by
Templeton Melinda
Current Estimated Value
Home Financials for this Owner
Home Financials are based on the most recent Mortgage that was taken out on this home.
Original Mortgage
$110,040
Outstanding Balance
$100,678
Interest Rate
2.88%
Mortgage Type
Future Advance Clause Open End Mortgage
Estimated Equity
$117,721
Purchase Details
Closed on
Jul 15, 2021
Sold by
Pdp Investments Llc
Bought by
Magel Matthew
Home Financials for this Owner
Home Financials are based on the most recent Mortgage that was taken out on this home.
Original Mortgage
$74,200
Interest Rate
2.93%
Mortgage Type
Unknown
Purchase Details
Closed on
Dec 29, 2006
Sold by
Parrish Leroy E and Parrish Oneita Joan
Bought by
Pdp Investments Llc
Create a Home Valuation Report for This Property
The Home Valuation Report is an in-depth analysis detailing your home's value as well as a comparison with similar homes in the area
Home Values in the Area
Average Home Value in this Area
Purchase History
| Date | Buyer | Sale Price | Title Company |
|---|---|---|---|
| Templeton Melinda | -- | Security 1St Title | |
| Magel Matthew | -- | Affinity Title Llc | |
| Pdp Investments Llc | -- | None Available |
Source: Public Records
Mortgage History
| Date | Status | Borrower | Loan Amount |
|---|---|---|---|
| Open | Templeton Melinda | $110,040 | |
| Previous Owner | Magel Matthew | $74,200 |
Source: Public Records
Tax History Compared to Growth
Tax History
| Year | Tax Paid | Tax Assessment Tax Assessment Total Assessment is a certain percentage of the fair market value that is determined by local assessors to be the total taxable value of land and additions on the property. | Land | Improvement |
|---|---|---|---|---|
| 2025 | $2,026 | $29,770 | -- | -- |
| 2024 | $2,026 | $25,900 | -- | -- |
| 2023 | $2,026 | $25,900 | $0 | $0 |
| 2022 | $1,803 | $22,760 | $0 | $0 |
| 2021 | $1,789 | $22,762 | $4,750 | $18,012 |
| 2020 | $1,698 | $20,290 | $0 | $0 |
| 2019 | $1,698 | $20,292 | $4,750 | $15,542 |
| 2018 | $1,490 | $17,480 | $0 | $0 |
| 2017 | $0 | $17,480 | $3,800 | $13,680 |
| 2016 | $1,476 | $17,480 | $3,800 | $13,680 |
| 2015 | $1,476 | $17,480 | $3,800 | $13,680 |
| 2014 | $1,488 | $17,480 | $3,800 | $13,680 |
Source: Public Records
Map
Nearby Homes