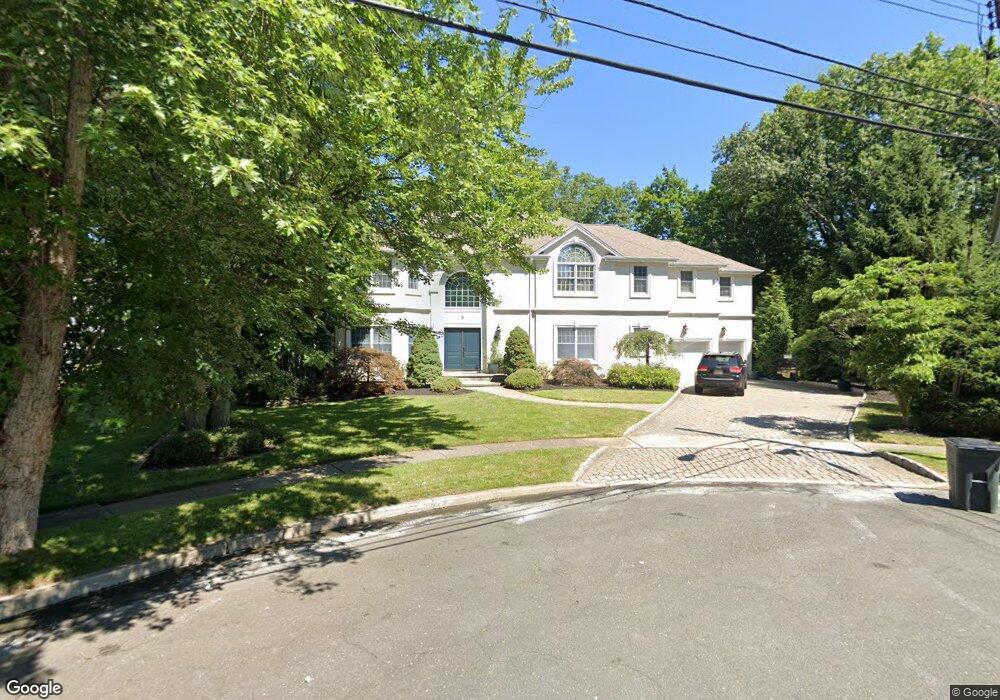
8 Wainwright Ct Closter, NJ 07624
Estimated Value: $1,907,930 - $2,310,000
Studio
--
Bath
3,823
Sq Ft
$540/Sq Ft
Est. Value
About This Home
This home is located at 8 Wainwright Ct, Closter, NJ 07624 and is currently estimated at $2,064,483, approximately $540 per square foot. 8 Wainwright Ct is a home located in Bergen County with nearby schools including Hillside Elementary School, Tenakill Middle School, and Northern Valley Regional High School at Demarest.
Ownership History
Date
Name
Owned For
Owner Type
Purchase Details
Closed on
Apr 6, 2004
Sold by
Moon Taewon
Bought by
Yuder John and Yuder Julie Nee
Current Estimated Value
Purchase Details
Closed on
Dec 15, 1999
Sold by
Koushagjian Kevork G
Bought by
Moon Taewon and Moon Hwa Young
Home Financials for this Owner
Home Financials are based on the most recent Mortgage that was taken out on this home.
Original Mortgage
$641,000
Interest Rate
7.37%
Purchase Details
Closed on
Jan 19, 1999
Sold by
Yoon Chu Pang and Yoon Mi Kyung
Bought by
Koushagjian Kevork G
Purchase Details
Closed on
Apr 22, 1994
Sold by
Peiffer Dale
Bought by
Yoon Chu Pang and Yoon Mi Kyung
Home Financials for this Owner
Home Financials are based on the most recent Mortgage that was taken out on this home.
Original Mortgage
$120,000
Interest Rate
7.7%
Create a Home Valuation Report for This Property
The Home Valuation Report is an in-depth analysis detailing your home's value as well as a comparison with similar homes in the area
Home Values in the Area
Average Home Value in this Area
Purchase History
| Date | Buyer | Sale Price | Title Company |
|---|---|---|---|
| Yuder John | $1,260,000 | -- | |
| Moon Taewon | $855,000 | -- | |
| Koushagjian Kevork G | $300,000 | -- | |
| Yoon Chu Pang | $222,000 | -- |
Source: Public Records
Mortgage History
| Date | Status | Borrower | Loan Amount |
|---|---|---|---|
| Previous Owner | Moon Taewon | $641,000 | |
| Previous Owner | Yoon Chu Pang | $120,000 |
Source: Public Records
Tax History
| Year | Tax Paid | Tax Assessment Tax Assessment Total Assessment is a certain percentage of the fair market value that is determined by local assessors to be the total taxable value of land and additions on the property. | Land | Improvement |
|---|---|---|---|---|
| 2025 | $27,806 | $1,382,300 | $608,500 | $773,800 |
| 2024 | $27,493 | $1,314,100 | $588,500 | $725,600 |
| 2023 | $25,956 | $1,282,300 | $568,500 | $713,800 |
| 2022 | $25,956 | $1,173,400 | $494,000 | $679,400 |
| 2021 | $26,236 | $1,140,400 | $479,000 | $661,400 |
| 2020 | $25,724 | $1,147,900 | $481,500 | $666,400 |
| 2019 | $25,294 | $1,140,900 | $477,500 | $663,400 |
| 2018 | $25,040 | $1,124,900 | $471,500 | $653,400 |
| 2017 | $27,822 | $1,219,200 | $449,800 | $769,400 |
| 2016 | $27,298 | $1,219,200 | $449,800 | $769,400 |
| 2015 | $26,700 | $1,193,100 | $449,800 | $743,300 |
| 2014 | $25,401 | $1,193,100 | $449,800 | $743,300 |
Source: Public Records
Map
Nearby Homes
- 25 Macarthur Ave
- 8 Church Ct
- 186 Hickory Ln
- 165 Hickory Ln
- 379 Anderson Ave
- 47 Susan Dr
- 75 Susan Dr
- 543 Closter Dock Rd
- 28 Buckingham Dr
- 12 Cambridge Way
- 11 Sherwood Ct
- 44 Pine Terrace
- 504 High St
- 40 County Rd
- 351 Closter Dock Rd
- 19 Autumn Terrace
- 36 Marie Major Dr
- 32 Litchfield Way
- 16 Poplar Rd
- 34 Cambridge Way
Your Personal Tour Guide
Ask me questions while you tour the home.