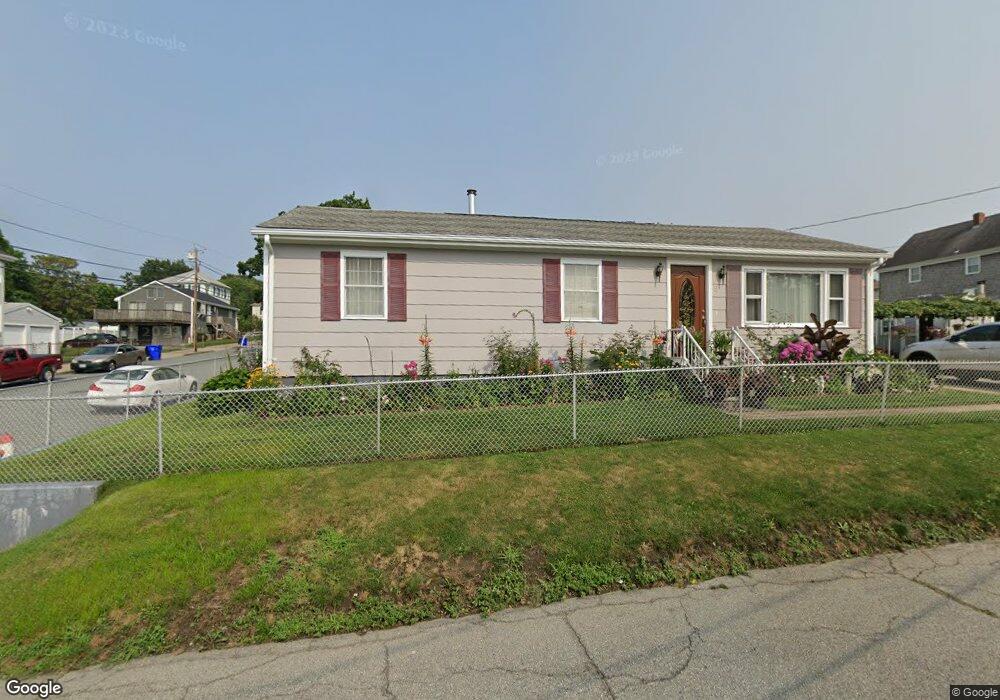
8 Woodstock St Fall River, MA 02724
Sandy Beach NeighborhoodEstimated Value: $407,943 - $449,000
3
Beds
1
Bath
2,006
Sq Ft
$216/Sq Ft
Est. Value
About This Home
This home is located at 8 Woodstock St, Fall River, MA 02724 and is currently estimated at $432,486, approximately $215 per square foot. 8 Woodstock St is a home located in Bristol County with nearby schools including Carlton M. Viveiros Elementary School, Matthew J. Kuss Middle School, and B M C Durfee High School.
Ownership History
Date
Name
Owned For
Owner Type
Purchase Details
Closed on
Aug 6, 2014
Sold by
Viveiros Gabriel S and Viveiros Gabriel
Bought by
Viveiros Gabriel and Viveiros Maria
Current Estimated Value
Purchase Details
Closed on
Oct 27, 1988
Sold by
Dupuis Gerald F
Bought by
Viveiros Gabriel S
Home Financials for this Owner
Home Financials are based on the most recent Mortgage that was taken out on this home.
Original Mortgage
$92,000
Interest Rate
10.32%
Mortgage Type
Purchase Money Mortgage
Create a Home Valuation Report for This Property
The Home Valuation Report is an in-depth analysis detailing your home's value as well as a comparison with similar homes in the area
Home Values in the Area
Average Home Value in this Area
Purchase History
| Date | Buyer | Sale Price | Title Company |
|---|---|---|---|
| Viveiros Gabriel | -- | -- | |
| Viveiros Gabriel S | $122,000 | -- |
Source: Public Records
Mortgage History
| Date | Status | Borrower | Loan Amount |
|---|---|---|---|
| Previous Owner | Viveiros Gabriel S | $100,000 | |
| Previous Owner | Viveiros Gabriel S | $13,208 | |
| Previous Owner | Viveiros Gabriel S | $92,000 |
Source: Public Records
Tax History Compared to Growth
Tax History
| Year | Tax Paid | Tax Assessment Tax Assessment Total Assessment is a certain percentage of the fair market value that is determined by local assessors to be the total taxable value of land and additions on the property. | Land | Improvement |
|---|---|---|---|---|
| 2025 | $3,777 | $329,900 | $124,900 | $205,000 |
| 2024 | $3,524 | $306,700 | $120,100 | $186,600 |
| 2023 | $3,366 | $274,300 | $103,000 | $171,300 |
| 2022 | $2,916 | $231,100 | $93,600 | $137,500 |
| 2021 | $2,766 | $200,000 | $86,600 | $113,400 |
| 2020 | $2,659 | $184,000 | $82,900 | $101,100 |
| 2019 | $2,366 | $162,300 | $79,000 | $83,300 |
| 2018 | $2,310 | $158,000 | $77,500 | $80,500 |
| 2017 | $2,213 | $158,100 | $79,100 | $79,000 |
| 2016 | $2,140 | $157,000 | $82,300 | $74,700 |
| 2015 | $2,044 | $156,300 | $79,300 | $77,000 |
| 2014 | $2,019 | $160,500 | $83,500 | $77,000 |
Source: Public Records
Map
Nearby Homes