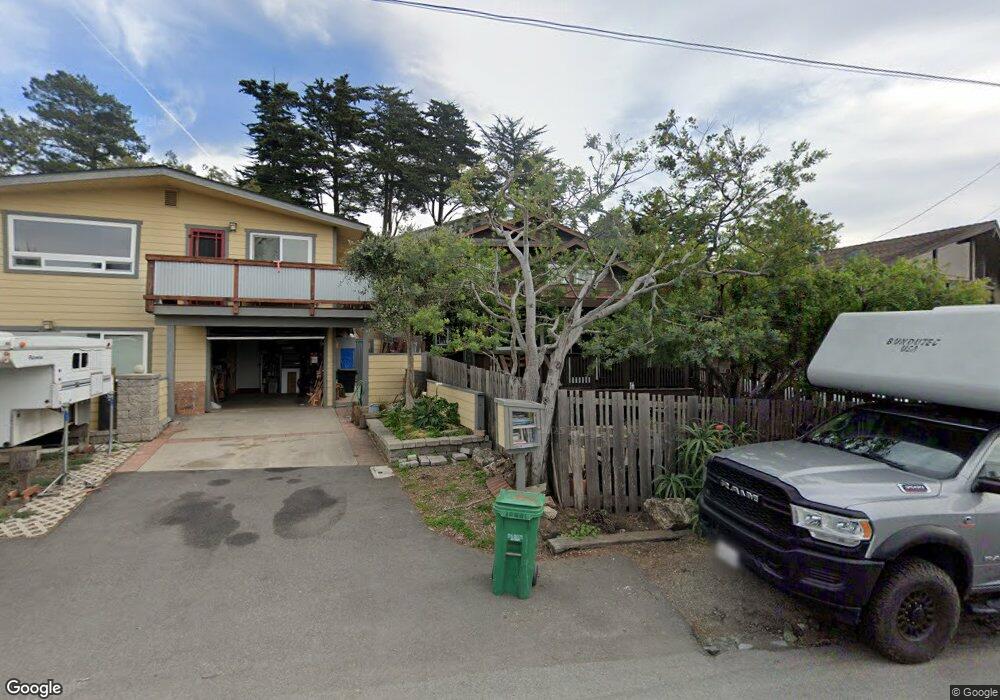
80 13th St Cayucos, CA 93430
Cayucos NeighborhoodEstimated Value: $648,000 - $1,546,000
1
Bed
1
Bath
1,436
Sq Ft
$772/Sq Ft
Est. Value
About This Home
This home is located at 80 13th St, Cayucos, CA 93430 and is currently estimated at $1,108,993, approximately $772 per square foot. 80 13th St is a home located in San Luis Obispo County.
Ownership History
Date
Name
Owned For
Owner Type
Purchase Details
Closed on
Mar 2, 2017
Sold by
Freeh Daniel Morris and Freeh Taren Ann
Bought by
Freeh Daniel M and Freeh Taren A
Current Estimated Value
Purchase Details
Closed on
Feb 10, 2003
Sold by
Freeh Daniel Morris and Freeh Taren Ann
Bought by
Freeh Daniel Morris and Freeh Taren Ann
Home Financials for this Owner
Home Financials are based on the most recent Mortgage that was taken out on this home.
Original Mortgage
$172,000
Outstanding Balance
$71,780
Interest Rate
5.6%
Estimated Equity
$1,037,213
Purchase Details
Closed on
Feb 7, 2001
Sold by
Watson William A and Watson Jennifer Freeh
Bought by
Freeh Daniel Morris and Freeh Taren Ann
Home Financials for this Owner
Home Financials are based on the most recent Mortgage that was taken out on this home.
Original Mortgage
$150,000
Interest Rate
7.08%
Purchase Details
Closed on
Jul 16, 1997
Sold by
Kupper Kurt P
Bought by
Freeh Daniel Morris and Foley Taren Ann
Home Financials for this Owner
Home Financials are based on the most recent Mortgage that was taken out on this home.
Original Mortgage
$120,000
Interest Rate
7.42%
Create a Home Valuation Report for This Property
The Home Valuation Report is an in-depth analysis detailing your home's value as well as a comparison with similar homes in the area
Home Values in the Area
Average Home Value in this Area
Purchase History
| Date | Buyer | Sale Price | Title Company |
|---|---|---|---|
| Freeh Daniel M | -- | None Available | |
| Freeh Daniel Morris | -- | Cuesta Title Company | |
| Freeh Daniel Morris | -- | Chicago Title Co | |
| Freeh Daniel Morris | $150,000 | Chicago Title Co |
Source: Public Records
Mortgage History
| Date | Status | Borrower | Loan Amount |
|---|---|---|---|
| Open | Freeh Daniel Morris | $172,000 | |
| Closed | Freeh Daniel Morris | $150,000 | |
| Previous Owner | Freeh Daniel Morris | $120,000 |
Source: Public Records
Tax History
| Year | Tax Paid | Tax Assessment Tax Assessment Total Assessment is a certain percentage of the fair market value that is determined by local assessors to be the total taxable value of land and additions on the property. | Land | Improvement |
|---|---|---|---|---|
| 2025 | $3,607 | $345,586 | $202,570 | $143,016 |
| 2024 | $3,564 | $338,811 | $198,599 | $140,212 |
| 2023 | $3,564 | $332,168 | $194,705 | $137,463 |
| 2022 | $3,501 | $325,656 | $190,888 | $134,768 |
| 2021 | $3,447 | $319,272 | $187,146 | $132,126 |
| 2020 | $3,409 | $316,000 | $185,228 | $130,772 |
| 2019 | $3,341 | $309,805 | $181,597 | $128,208 |
| 2018 | $3,273 | $303,732 | $178,037 | $125,695 |
| 2017 | $3,206 | $297,778 | $174,547 | $123,231 |
| 2016 | $3,141 | $291,940 | $171,125 | $120,815 |
| 2015 | $3,112 | $287,556 | $168,555 | $119,001 |
| 2014 | $3,003 | $281,924 | $165,254 | $116,670 |
Source: Public Records
Map
Nearby Homes
- 1625 Cass Ave Unit 22
- 29 11th St
- 1234 Pacific Ave
- 2023 Circle Dr
- 96 24th St
- 0 California 1
- 50 S 3rd St
- 31 N 3rd St
- 0 Studio Dr
- 191 J St
- 2651 Richard Ave
- 2670 Studio Dr
- 0 Ash Ave Unit SC25116716
- 77 N Ocean Ave Unit 8
- 77 N Ocean Ave Unit 12
- 2712 Studio Dr
- 340 D St
- 159 Ash Ave
- 130 Cypress Ave
- 2901 Ocean Blvd
Your Personal Tour Guide
Ask me questions while you tour the home.