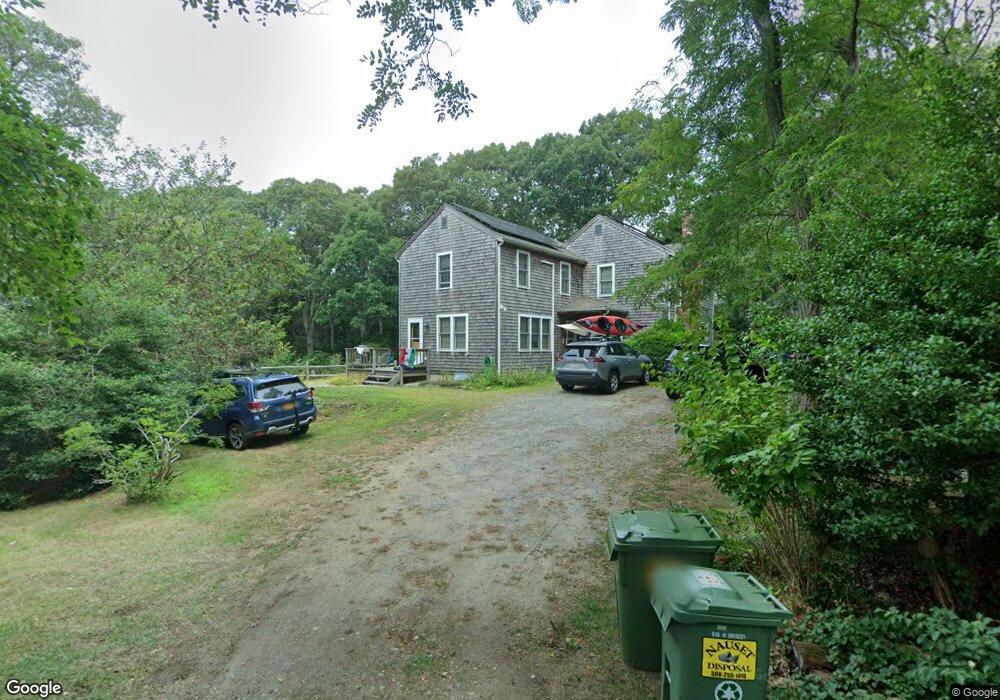
80 Chipman St Eastham, MA 02642
Estimated Value: $1,003,000 - $1,154,000
3
Beds
4
Baths
2,278
Sq Ft
$472/Sq Ft
Est. Value
About This Home
This home is located at 80 Chipman St, Eastham, MA 02642 and is currently estimated at $1,074,582, approximately $471 per square foot. 80 Chipman St is a home located in Barnstable County with nearby schools including Eastham Elementary School, Nauset Regional Middle School, and Nauset Regional High School.
Ownership History
Date
Name
Owned For
Owner Type
Purchase Details
Closed on
Sep 2, 2010
Sold by
Ganter Brenda and Ganter Robert
Bought by
Doret Stephen C and Doret Gretchen F
Current Estimated Value
Home Financials for this Owner
Home Financials are based on the most recent Mortgage that was taken out on this home.
Original Mortgage
$417,000
Interest Rate
4.55%
Mortgage Type
Purchase Money Mortgage
Purchase Details
Closed on
Jan 26, 1996
Sold by
Chipman St Nt and Bateman Francis L
Bought by
Ganter Maxine J and Wayne Ganter W
Home Financials for this Owner
Home Financials are based on the most recent Mortgage that was taken out on this home.
Original Mortgage
$124,500
Interest Rate
7.13%
Mortgage Type
Purchase Money Mortgage
Create a Home Valuation Report for This Property
The Home Valuation Report is an in-depth analysis detailing your home's value as well as a comparison with similar homes in the area
Home Values in the Area
Average Home Value in this Area
Purchase History
| Date | Buyer | Sale Price | Title Company |
|---|---|---|---|
| Doret Stephen C | $600,000 | -- | |
| Ganter Maxine J | $146,500 | -- |
Source: Public Records
Mortgage History
| Date | Status | Borrower | Loan Amount |
|---|---|---|---|
| Open | Ganter Maxine J | $363,500 | |
| Closed | Doret Stephen C | $417,000 | |
| Previous Owner | Ganter Maxine J | $100,000 | |
| Previous Owner | Ganter Maxine J | $124,500 | |
| Previous Owner | Ganter Maxine J | $150,000 |
Source: Public Records
Tax History
| Year | Tax Paid | Tax Assessment Tax Assessment Total Assessment is a certain percentage of the fair market value that is determined by local assessors to be the total taxable value of land and additions on the property. | Land | Improvement |
|---|---|---|---|---|
| 2025 | $7,227 | $937,400 | $429,300 | $508,100 |
| 2024 | $6,218 | $887,000 | $416,800 | $470,200 |
| 2023 | $5,795 | $800,400 | $386,000 | $414,400 |
| 2022 | $5,491 | $640,000 | $344,600 | $295,400 |
| 2021 | $5,337 | $581,400 | $313,200 | $268,200 |
| 2020 | $5,003 | $573,700 | $319,700 | $254,000 |
| 2019 | $4,596 | $557,100 | $310,400 | $246,700 |
| 2018 | $4,542 | $543,900 | $301,400 | $242,500 |
| 2017 | $4,211 | $533,100 | $295,400 | $237,700 |
| 2016 | $4,025 | $541,000 | $295,400 | $245,600 |
| 2015 | $3,685 | $519,000 | $289,600 | $229,400 |
Source: Public Records
Map
Nearby Homes
- 300 School House Rd
- 82 Old Orchard Rd
- 70 Deerfield Ln
- 25 Forrest Ave
- 315 Candlewood Dr
- 2705 State Hwy
- 2705 State Hwy Unit 1-8
- 600 Kingsbury Beach Rd
- 255 Massasoit Rd
- 20 Oak Rd
- 10 Bradford Ln
- 20 Billingsgate Ave
- 85 Huckleberry Ln
- 18 Jay Dee Ln
- 135 Nauset Light Beach Rd
- 245 Nauset Light Beach Rd
- 55 Grandfathers Way
- 330 Hay Rd
- 5470 State Hwy
- 157 Brownell Rd
Your Personal Tour Guide
Ask me questions while you tour the home.