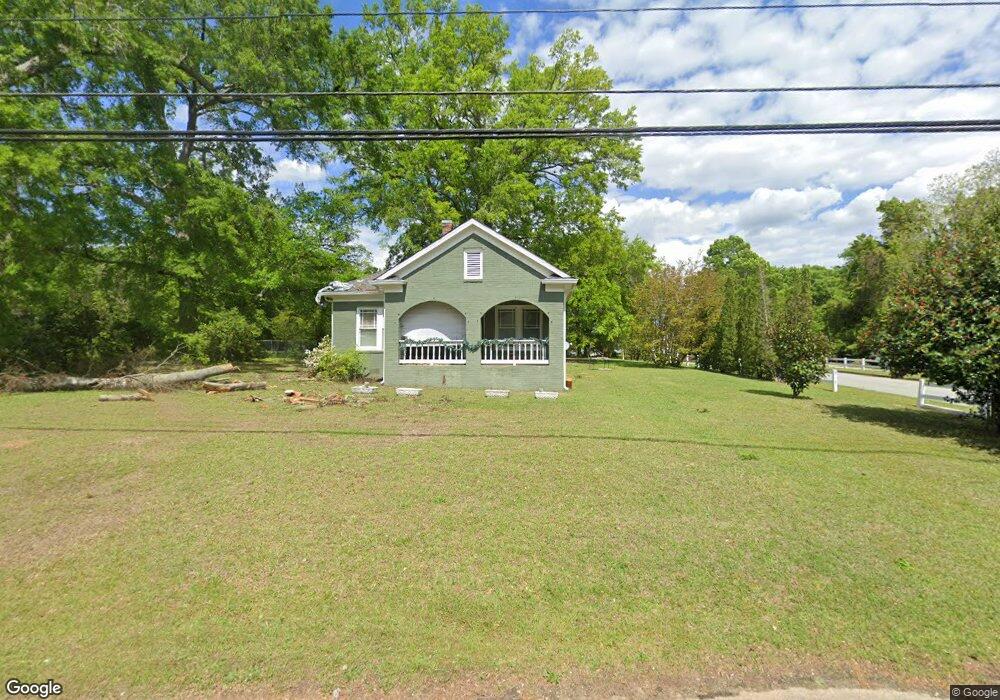
80 E Main St N Hampton, GA 30228
Estimated Value: $254,000 - $287,087
3
Beds
2
Baths
1,419
Sq Ft
$192/Sq Ft
Est. Value
About This Home
This home is located at 80 E Main St N, Hampton, GA 30228 and is currently estimated at $272,022, approximately $191 per square foot. 80 E Main St N is a home located in Henry County with nearby schools including Rocky Creek Elementary School, Hampton Middle School, and Hampton High School.
Ownership History
Date
Name
Owned For
Owner Type
Purchase Details
Closed on
Aug 28, 2020
Sold by
Davis Charles E
Bought by
Walls Cornelius B and Walls Shannon
Current Estimated Value
Home Financials for this Owner
Home Financials are based on the most recent Mortgage that was taken out on this home.
Original Mortgage
$186,459
Outstanding Balance
$163,960
Interest Rate
2.9%
Mortgage Type
FHA
Estimated Equity
$108,062
Purchase Details
Closed on
Jul 16, 2018
Sold by
Lynch Bobby W
Bought by
Concept Investment & Property Management
Purchase Details
Closed on
Jan 17, 2013
Sold by
Maggert Constance R
Bought by
Lynch Bobby W
Create a Home Valuation Report for This Property
The Home Valuation Report is an in-depth analysis detailing your home's value as well as a comparison with similar homes in the area
Home Values in the Area
Average Home Value in this Area
Purchase History
| Date | Buyer | Sale Price | Title Company |
|---|---|---|---|
| Walls Cornelius B | $189,900 | -- | |
| Concept Investment & Property Management | $80,000 | -- | |
| Lynch Bobby W | $64,000 | -- |
Source: Public Records
Mortgage History
| Date | Status | Borrower | Loan Amount |
|---|---|---|---|
| Open | Walls Cornelius B | $186,459 |
Source: Public Records
Tax History
| Year | Tax Paid | Tax Assessment Tax Assessment Total Assessment is a certain percentage of the fair market value that is determined by local assessors to be the total taxable value of land and additions on the property. | Land | Improvement |
|---|---|---|---|---|
| 2025 | $4,786 | $135,520 | $12,760 | $122,760 |
| 2024 | $4,786 | $126,720 | $11,520 | $115,200 |
| 2023 | $4,769 | $119,520 | $11,080 | $108,440 |
| 2022 | $3,688 | $90,760 | $10,240 | $80,520 |
| 2021 | $2,711 | $74,880 | $8,800 | $66,080 |
| 2020 | $359 | $45,960 | $8,280 | $37,680 |
| 2019 | $353 | $41,760 | $7,840 | $33,920 |
| 2018 | $1,573 | $43,040 | $7,240 | $35,800 |
| 2016 | $1,355 | $37,160 | $5,680 | $31,480 |
| 2015 | $1,073 | $28,400 | $6,440 | $21,960 |
| 2014 | -- | $25,600 | $6,298 | $19,302 |
Source: Public Records
Map
Nearby Homes
- 55 Porter Cir
- 2025 Elm Grove Ln
- 260 Sandstone Dr
- 252 Sandstone Dr
- 1903 Elm Park Dr
- 120 Caldwell Dr
- 248 Fern Ct
- 21 Elm St
- 220 Windpher Ridge
- 25 Georgia Ave
- 13 Derrick St
- 28 Elm St
- 6 Derrick St
- 42 Elm St
- 32 Mcdonough St
- 48 Magnolia Pkwy
- 10 Plum Blossom Ln
- 169 Cabin Way
- 80 Knolls Ridge
- 446 Sawmill Trace
Your Personal Tour Guide
Ask me questions while you tour the home.