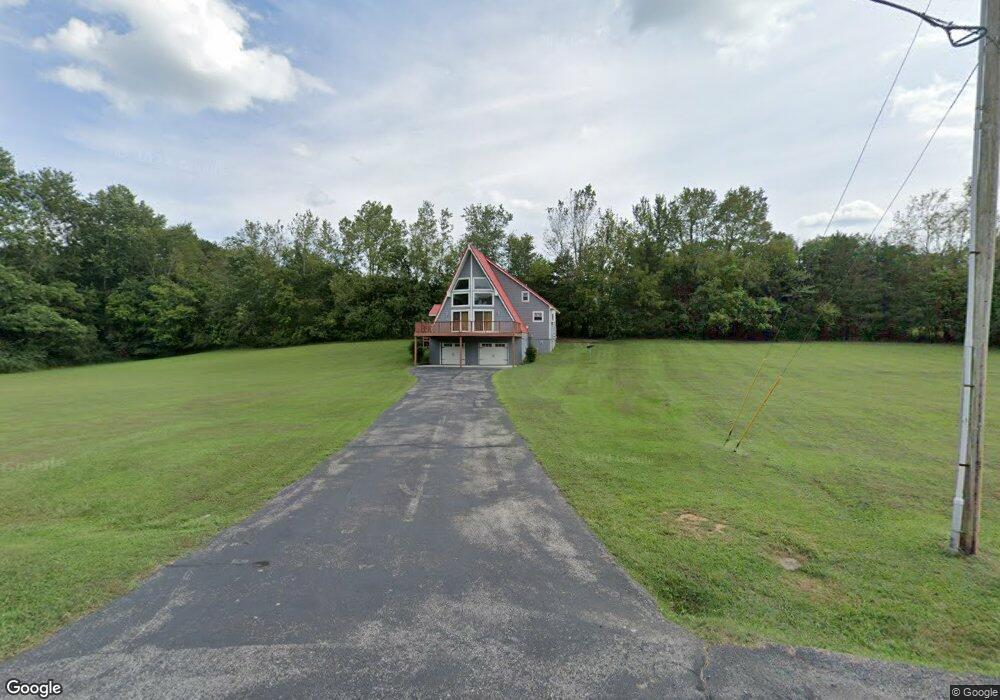
80 Hidden River Ln Sparta, TN 38583
Estimated Value: $261,060 - $444,000
3
Beds
2
Baths
2,041
Sq Ft
$163/Sq Ft
Est. Value
About This Home
This home is located at 80 Hidden River Ln, Sparta, TN 38583 and is currently estimated at $333,515, approximately $163 per square foot. 80 Hidden River Ln is a home located in Van Buren County with nearby schools including Spencer Elementary School and Van Buren County High School.
Ownership History
Date
Name
Owned For
Owner Type
Purchase Details
Closed on
Aug 2, 2006
Sold by
Brown Marsha L
Bought by
Hubert Matthews
Current Estimated Value
Home Financials for this Owner
Home Financials are based on the most recent Mortgage that was taken out on this home.
Original Mortgage
$118,400
Interest Rate
6.74%
Mortgage Type
Cash
Purchase Details
Closed on
Oct 4, 2005
Sold by
Not Provided
Bought by
Matthews Hubert and Anna Matthews
Purchase Details
Closed on
Oct 1, 2004
Bought by
Turney Dennis R Lois Turney
Purchase Details
Closed on
May 10, 2001
Bought by
Citizens Bank Of Sparta
Purchase Details
Closed on
Feb 5, 1999
Bought by
Gibson Richard and Gibson Tammy
Purchase Details
Closed on
Apr 25, 1994
Bought by
J D L Properties Inc
Create a Home Valuation Report for This Property
The Home Valuation Report is an in-depth analysis detailing your home's value as well as a comparison with similar homes in the area
Home Values in the Area
Average Home Value in this Area
Purchase History
| Date | Buyer | Sale Price | Title Company |
|---|---|---|---|
| Hubert Matthews | $148,000 | -- | |
| Matthews Hubert | $95,000 | -- | |
| Turney Dennis R Lois Turney | $68,600 | -- | |
| Citizens Bank Of Sparta | $55,000 | -- | |
| Gibson Richard | -- | -- | |
| J D L Properties Inc | -- | -- |
Source: Public Records
Mortgage History
| Date | Status | Borrower | Loan Amount |
|---|---|---|---|
| Closed | J D L Properties Inc | $118,400 |
Source: Public Records
Tax History Compared to Growth
Tax History
| Year | Tax Paid | Tax Assessment Tax Assessment Total Assessment is a certain percentage of the fair market value that is determined by local assessors to be the total taxable value of land and additions on the property. | Land | Improvement |
|---|---|---|---|---|
| 2025 | $1,082 | $45,075 | $0 | $0 |
| 2024 | $1,082 | $45,075 | $8,000 | $37,075 |
| 2023 | $1,082 | $45,075 | $8,000 | $37,075 |
| 2022 | $1,082 | $45,075 | $8,000 | $37,075 |
| 2021 | $1,082 | $45,075 | $8,000 | $37,075 |
| 2020 | $1,053 | $45,075 | $8,000 | $37,075 |
| 2019 | $881 | $38,150 | $8,000 | $30,150 |
| 2018 | $736 | $38,150 | $8,000 | $30,150 |
| 2017 | $736 | $38,150 | $8,000 | $30,150 |
| 2016 | $736 | $38,150 | $8,000 | $30,150 |
| 2015 | $736 | $38,150 | $8,000 | $30,150 |
| 2014 | $704 | $38,150 | $8,000 | $30,150 |
| 2013 | $704 | $38,451 | $0 | $0 |
Source: Public Records
Map
Nearby Homes
- 0 Cane Creek-Cummingsville Rd
- 0 Hidden River Ave Unit 1323479
- 177 Hidden River Ave
- 1.85 AC Cane Creek-Cummingsville Rd
- 185 Cane Creek-Cummingsville Rd
- Lot 1 Rd
- Lot 5 Hwy 285 Cane Creek - Cummingsville Rd
- Lot 4 Hwy 285 Cane Creek - Cummingsville Rd
- 523 Doctor I C Morgan Rd
- 459 Doctor I C Morgan Rd
- 179 River Front Dr
- 253 River Front Dr
- 70 River Oaks Dr
- 88 River Oaks Dr
- 77 River Front Dr
- 263 River Oaks Dr
- 171 Overlook Dr
- 0 Big Bottom Rd Unit RTC2762488
- 2339 Cane Creek-Cummingsville Rd
- Lot 4 &5 Peaceful Ln
- 66 Hidden River Ln
- 0 Hidden River Ln Unit 1660032
- 0 Hidden River Ln Unit 1306241
- 0 Hidden River Ln Unit 198341
- 0 Hidden River Ln Unit RTC2574947
- 0 Hidden River Ln Unit RTC2354894
- 1529 Cane Creek Cummingsville Rd
- 134 Hidden River Ln
- 15 Hidden River Ave
- 0 Cane Creek Rd Unit 1281415
- 0 Cane Creek Rd Unit RTC2728297
- 0 Cane Creek Rd Unit 216390
- Lt 16-17 Hidden River
- 739 Cane Creek-Cummingsville Rd
- 14 Hidden River Ave
- 2 Hidden River Ave
- 186 Hidden River Ave
- 2.12ac Hidden River Ave
- 22 Hidden River Ave
- Lot 67&68 Hidden River Ave