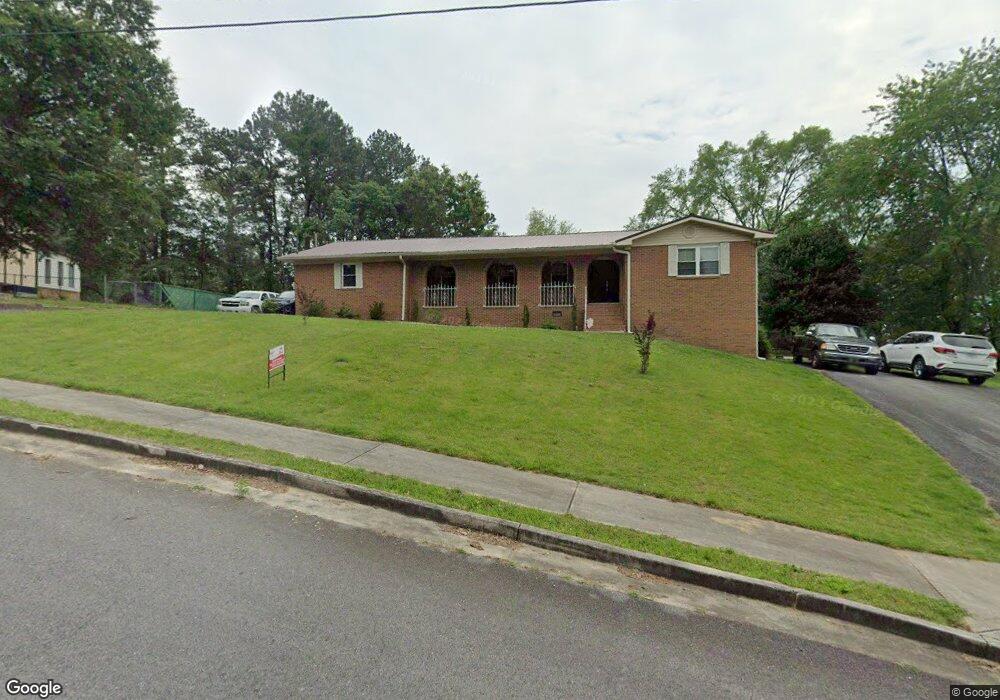
80 Hillcrest Dr Ringgold, TN 30736
Graysville NeighborhoodEstimated Value: $381,000 - $404,000
Studio
3
Baths
2,021
Sq Ft
$194/Sq Ft
Est. Value
About This Home
This home is located at 80 Hillcrest Dr, Ringgold, TN 30736 and is currently estimated at $391,857, approximately $193 per square foot. 80 Hillcrest Dr is a home located in Catoosa County with nearby schools including Battlefield Primary School, Battlefield Elementary School, and Lakeview Middle School.
Ownership History
Date
Name
Owned For
Owner Type
Purchase Details
Closed on
Jan 14, 2025
Sold by
Milligan Eddie Jean
Bought by
Dowd Daisy M
Current Estimated Value
Home Financials for this Owner
Home Financials are based on the most recent Mortgage that was taken out on this home.
Original Mortgage
$347,700
Outstanding Balance
$343,973
Interest Rate
6.72%
Mortgage Type
New Conventional
Estimated Equity
$47,884
Purchase Details
Closed on
Apr 25, 2024
Sold by
Garland Linda
Bought by
Milligan Eddie Jean and Milligan Mindy
Home Financials for this Owner
Home Financials are based on the most recent Mortgage that was taken out on this home.
Original Mortgage
$290,000
Interest Rate
6.79%
Mortgage Type
New Conventional
Purchase Details
Closed on
Sep 29, 2017
Bought by
Garland Linda
Home Financials for this Owner
Home Financials are based on the most recent Mortgage that was taken out on this home.
Original Mortgage
$117,826
Interest Rate
3.87%
Mortgage Type
FHA
Purchase Details
Closed on
Jan 14, 2009
Sold by
Price Ricky Fred
Bought by
Price Ricky Fred
Purchase Details
Closed on
Jan 13, 2009
Sold by
Price Betty J
Bought by
Price Ricky Fred
Create a Home Valuation Report for This Property
The Home Valuation Report is an in-depth analysis detailing your home's value as well as a comparison with similar homes in the area
Home Values in the Area
Average Home Value in this Area
Purchase History
| Date | Buyer | Sale Price | Title Company |
|---|---|---|---|
| Dowd Daisy M | $366,000 | -- | |
| Milligan Eddie Jean | $430,000 | -- | |
| Garland Linda | $120,000 | -- | |
| Price Ricky Fred | -- | -- | |
| Price Ricky Fred | -- | -- |
Source: Public Records
Mortgage History
| Date | Status | Borrower | Loan Amount |
|---|---|---|---|
| Open | Dowd Daisy M | $347,700 | |
| Previous Owner | Milligan Eddie Jean | $290,000 | |
| Previous Owner | Garland Linda | $117,826 |
Source: Public Records
Tax History
| Year | Tax Paid | Tax Assessment Tax Assessment Total Assessment is a certain percentage of the fair market value that is determined by local assessors to be the total taxable value of land and additions on the property. | Land | Improvement |
|---|---|---|---|---|
| 2025 | $2,936 | $154,620 | $16,000 | $138,620 |
| 2024 | $2,743 | $128,606 | $14,162 | $114,444 |
| 2023 | $1,650 | $101,906 | $14,162 | $87,744 |
| 2022 | $1,192 | $82,226 | $14,162 | $68,064 |
| 2021 | $1,721 | $82,226 | $14,162 | $68,064 |
| 2020 | $1,695 | $73,267 | $14,162 | $59,105 |
| 2019 | $1,884 | $80,549 | $13,580 | $66,969 |
| 2018 | $1,471 | $59,521 | $13,580 | $45,941 |
| 2017 | $1,679 | $67,970 | $13,580 | $54,390 |
| 2016 | $1,678 | $64,578 | $13,580 | $50,998 |
| 2015 | -- | $64,578 | $13,580 | $50,998 |
| 2014 | -- | $64,578 | $13,580 | $50,998 |
| 2013 | -- | $64,578 | $13,580 | $50,998 |
Source: Public Records
Map
Nearby Homes
- 136 Hillcrest Dr
- 0 Cloud Springs Rd Unit 131417
- 190 Larry Dr
- 89 W Highland Dr
- 80 W Highland Dr
- 226 Pine Grove Rd
- 92 Sue Ln
- 69 Morris Dr
- 89 Bowling Rd
- 27 Templin Hills Ln
- 0 Pine Grove Rd Unit 1522542
- 454 Wooten Rd
- 100 N Brent Dr
- 356 Tanager Cir
- 325 Cindy Cir
- 425 Creeks Jewell Dr
- 52 Creeks Jewell Dr
- 7104 Moreview Rd
- 312 Creeks Jewell Dr
- 6624 Hilton Dr
- 80 Hillcrest Dr
- 112 Hillcrest Dr
- 103 Hillcrest Dr
- 4712 Cloud Springs Rd
- 4676 Cloud Springs Rd
- 4842 Cloud Springs Rd
- 4692 Cloud Springs Rd
- 207 Hillcrest Dr
- 136 Hillcrest Dr
- 136 Hillcrestdr
- 4717 Cloud Springs Rd
- 138 Hillcrest Dr
- 1 Cloud Springs Rd
- 0 Cloud Springs Rd
- 0 Cloud Springs Rd Unit RTC2986621
- 0 Cloud Springs Rd Unit 1507454
- 0 Cloud Springs Rd Unit 1320429
- 0 Cloud Springs Rd Unit RTC2719268
- 0 Cloud Springs Rd Unit 1072548
- 0 Cloud Springs Rd Unit 1003002
Your Personal Tour Guide
Ask me questions while you tour the home.