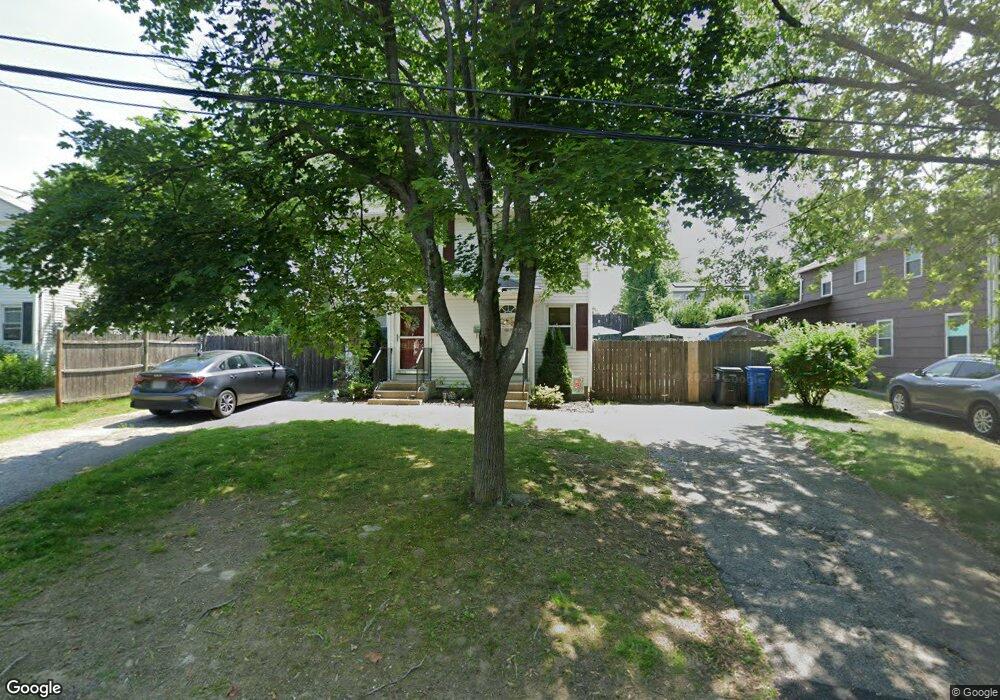
80 Loretta St Cranston, RI 02910
Forest Hills NeighborhoodEstimated Value: $429,364 - $508,000
4
Beds
2
Baths
1,780
Sq Ft
$272/Sq Ft
Est. Value
About This Home
This home is located at 80 Loretta St, Cranston, RI 02910 and is currently estimated at $483,841, approximately $271 per square foot. 80 Loretta St is a home located in Providence County with nearby schools including Woodridge Elementary School, Western Hills Middle School, and Cranston High School West.
Ownership History
Date
Name
Owned For
Owner Type
Purchase Details
Closed on
Jul 21, 2025
Sold by
Pennacchia Bruno and Pennacchia Marilyn L
Bought by
Pennacchia Anthony
Current Estimated Value
Purchase Details
Closed on
Jun 5, 2007
Sold by
Santagata Robert A
Bought by
Pennacchia Bruno and Pennacchia Marilyn
Home Financials for this Owner
Home Financials are based on the most recent Mortgage that was taken out on this home.
Original Mortgage
$221,250
Interest Rate
6.24%
Mortgage Type
Purchase Money Mortgage
Create a Home Valuation Report for This Property
The Home Valuation Report is an in-depth analysis detailing your home's value as well as a comparison with similar homes in the area
Home Values in the Area
Average Home Value in this Area
Purchase History
| Date | Buyer | Sale Price | Title Company |
|---|---|---|---|
| Pennacchia Anthony | -- | -- | |
| Pennacchia Anthony | -- | -- | |
| Pennacchia Bruno | $295,000 | -- | |
| Pennacchia Bruno | $295,000 | -- |
Source: Public Records
Mortgage History
| Date | Status | Borrower | Loan Amount |
|---|---|---|---|
| Previous Owner | Pennacchia Bruno | $209,400 | |
| Previous Owner | Pennacchia Bruno | $221,250 |
Source: Public Records
Tax History Compared to Growth
Tax History
| Year | Tax Paid | Tax Assessment Tax Assessment Total Assessment is a certain percentage of the fair market value that is determined by local assessors to be the total taxable value of land and additions on the property. | Land | Improvement |
|---|---|---|---|---|
| 2025 | $4,736 | $341,200 | $103,900 | $237,300 |
| 2024 | $4,644 | $341,200 | $103,900 | $237,300 |
| 2023 | $4,744 | $251,000 | $71,700 | $179,300 |
| 2022 | $4,646 | $251,000 | $71,700 | $179,300 |
| 2021 | $4,518 | $251,000 | $71,700 | $179,300 |
| 2020 | $4,536 | $218,400 | $75,100 | $143,300 |
| 2019 | $4,536 | $218,400 | $75,100 | $143,300 |
| 2018 | $4,431 | $218,400 | $75,100 | $143,300 |
| 2017 | $4,324 | $188,500 | $68,200 | $120,300 |
| 2016 | $4,232 | $188,500 | $68,200 | $120,300 |
| 2015 | $4,232 | $188,500 | $68,200 | $120,300 |
| 2014 | $4,550 | $199,200 | $68,200 | $131,000 |
Source: Public Records
Map
Nearby Homes