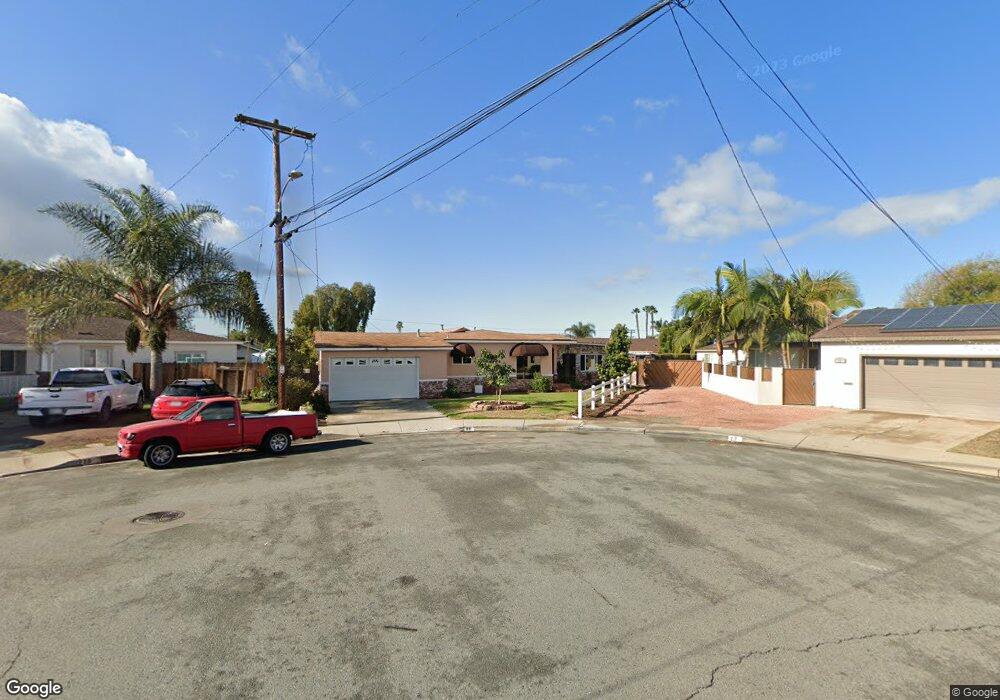
80 Murray St Chula Vista, CA 91910
Hilltop NeighborhoodEstimated Value: $731,000 - $834,000
3
Beds
2
Baths
1,438
Sq Ft
$550/Sq Ft
Est. Value
About This Home
This home is located at 80 Murray St, Chula Vista, CA 91910 and is currently estimated at $790,569, approximately $549 per square foot. 80 Murray St is a home located in San Diego County with nearby schools including Hilltop Drive Elementary School, Hilltop Middle School, and Hilltop Senior High School.
Ownership History
Date
Name
Owned For
Owner Type
Purchase Details
Closed on
Jun 1, 2017
Sold by
Maciel Alfonso and Maciel Janet L
Bought by
Maciel Alfonso and Maciel Janet L
Current Estimated Value
Purchase Details
Closed on
Aug 18, 2003
Sold by
Maciel Alfonso
Bought by
Maciel Alfonso and Maciel Janet L
Home Financials for this Owner
Home Financials are based on the most recent Mortgage that was taken out on this home.
Original Mortgage
$94,000
Interest Rate
4.9%
Mortgage Type
Purchase Money Mortgage
Purchase Details
Closed on
Dec 12, 1995
Sold by
Hinzo Richard A and Hinzo Gloria M
Bought by
Maciel Alfonso
Home Financials for this Owner
Home Financials are based on the most recent Mortgage that was taken out on this home.
Original Mortgage
$31,500
Interest Rate
7.18%
Mortgage Type
Seller Take Back
Purchase Details
Closed on
Aug 29, 1995
Sold by
Martinez Armida
Bought by
Maciel Alfonso
Home Financials for this Owner
Home Financials are based on the most recent Mortgage that was taken out on this home.
Original Mortgage
$105,000
Interest Rate
7.92%
Create a Home Valuation Report for This Property
The Home Valuation Report is an in-depth analysis detailing your home's value as well as a comparison with similar homes in the area
Home Values in the Area
Average Home Value in this Area
Purchase History
| Date | Buyer | Sale Price | Title Company |
|---|---|---|---|
| Maciel Alfonso | -- | None Available | |
| Maciel Alfonso | -- | Fidelity National Title Co | |
| Maciel Alfonso | -- | South Coast Title Company | |
| Maciel Alfonso | -- | Fidelity National Title |
Source: Public Records
Mortgage History
| Date | Status | Borrower | Loan Amount |
|---|---|---|---|
| Closed | Maciel Alfonso | $94,000 | |
| Closed | Maciel Alfonso | $31,500 | |
| Previous Owner | Maciel Alfonso | $105,000 | |
| Closed | Maciel Alfonso | $8,000 |
Source: Public Records
Tax History
| Year | Tax Paid | Tax Assessment Tax Assessment Total Assessment is a certain percentage of the fair market value that is determined by local assessors to be the total taxable value of land and additions on the property. | Land | Improvement |
|---|---|---|---|---|
| 2025 | $2,066 | $184,409 | $73,194 | $111,215 |
| 2024 | $2,066 | $180,794 | $71,759 | $109,035 |
| 2023 | $2,035 | $177,250 | $70,352 | $106,898 |
| 2022 | $1,975 | $173,775 | $68,973 | $104,802 |
| 2021 | $1,929 | $170,369 | $67,621 | $102,748 |
| 2020 | $1,882 | $168,623 | $66,928 | $101,695 |
| 2019 | $1,833 | $165,317 | $65,616 | $99,701 |
| 2018 | $1,803 | $162,077 | $64,330 | $97,747 |
| 2017 | $10 | $158,900 | $63,069 | $95,831 |
| 2016 | $1,720 | $155,785 | $61,833 | $93,952 |
| 2015 | $1,695 | $153,446 | $60,905 | $92,541 |
| 2014 | $1,666 | $150,441 | $59,712 | $90,729 |
Source: Public Records
Map
Nearby Homes
- 633 Del Mar Ave
- 516 Carla Ave
- 112 Country Club Dr
- 617 3rd Ave Unit 14
- 765 Church Ave
- 86 Via de Laurencio
- 166 Via de Laurencio
- 431 Del Mar Ct
- 202 E J St
- 268 Sierra Way
- 927 Agua Tibia Ave
- 520 Glover Ave
- 600 Sheffield Ct Unit 23
- 415 Carvalos Dr
- 316 1st Ave
- 274 Madrona St
- 338 2nd Ave
- 0 Julian Estates Rd Ct Unit NP26049137
- 586 88 Roosevelt St
- 158 E L St
Your Personal Tour Guide
Ask me questions while you tour the home.