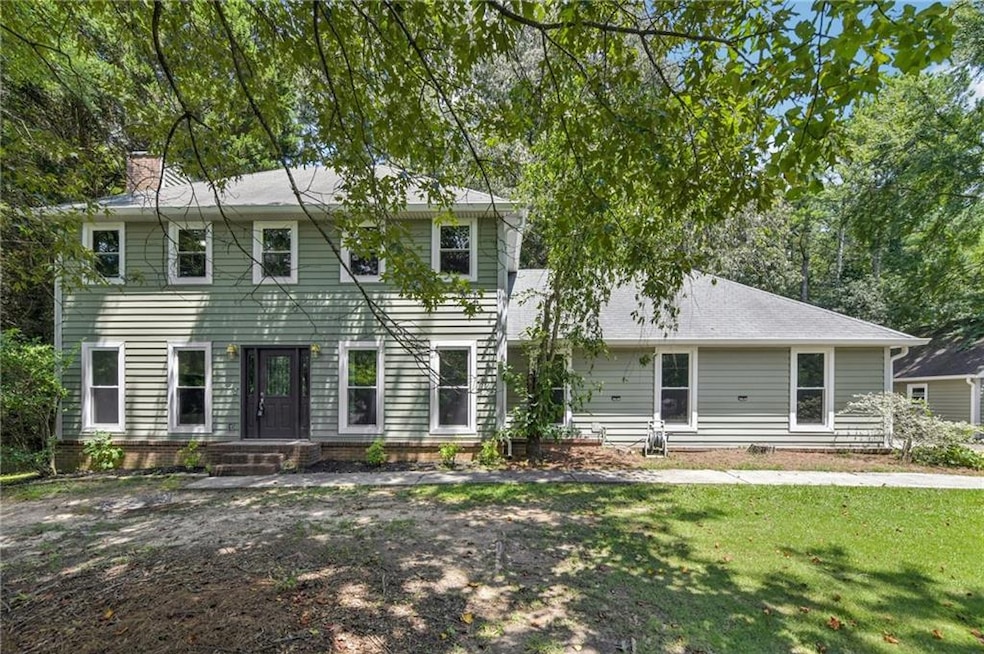


80 Oak Leaf Dr Stockbridge, GA 30281
Estimated payment $2,183/month
Highlights
- In Ground Pool
- Bonus Room
- Covered Patio or Porch
- Traditional Architecture
- Mud Room
- Breakfast Room
About This Home
Price improvement + $5,000 seller credit! Spacious 4 bedroom, 2.5 bath home in the Oak Forest community with NO HOA, pool, and plenty of room inside and out. This well-maintained home features a formal dining room, breakfast area, family room with a brick fireplace, and a versatile bonus/flex space. The kitchen is updated with modern countertops and appliances, and the home also boasts new siding, windows, and gutters with a lifetime warranty!
Upstairs, you’ll find generously sized bedrooms with walk-in closets. Step outside to your private backyard retreat complete with an in-ground pool, screened-in patio, new deck, and a peaceful fishpond surrounded by mature trees.
Additional highlights include a detached 2-car garage, extended driveway with ample parking, and a convenient location near shopping, restaurants, and major highways. Seller is motivated and open to concessions with a strong offer—schedule your private showing today, this one won’t last!
Listing Agent
Virtual Properties Realty.com License #330529 Listed on: 07/18/2025

Home Details
Home Type
- Single Family
Est. Annual Taxes
- $4,327
Year Built
- Built in 1985
Lot Details
- 3,485 Sq Ft Lot
- Back Yard Fenced and Front Yard
Parking
- 2 Car Garage
Home Design
- Traditional Architecture
- Cottage
- Slab Foundation
- Aluminum Siding
Interior Spaces
- 1,814 Sq Ft Home
- 2-Story Property
- Central Vacuum
- Ceiling Fan
- Fireplace With Gas Starter
- Mud Room
- Formal Dining Room
- Bonus Room
- Workshop
- Fire and Smoke Detector
Kitchen
- Breakfast Room
- Eat-In Kitchen
- Gas Range
- Dishwasher
Flooring
- Laminate
- Ceramic Tile
- Vinyl
Bedrooms and Bathrooms
- Walk-In Closet
Laundry
- Laundry in Mud Room
- Laundry Room
Outdoor Features
- In Ground Pool
- Covered Patio or Porch
- Separate Outdoor Workshop
Schools
- Pate's Creek Elementary School
- Dutchtown Middle School
- Dutchtown High School
Utilities
- Central Air
- Heating System Uses Natural Gas
- Septic Tank
Community Details
- Oak Forest Subdivision
Listing and Financial Details
- Assessor Parcel Number 032B01027000
Map
Home Values in the Area
Average Home Value in this Area
Tax History
| Year | Tax Paid | Tax Assessment Tax Assessment Total Assessment is a certain percentage of the fair market value that is determined by local assessors to be the total taxable value of land and additions on the property. | Land | Improvement |
|---|---|---|---|---|
| 2024 | $4,327 | $129,840 | $16,000 | $113,840 |
| 2023 | $3,561 | $120,200 | $14,000 | $106,200 |
| 2022 | $3,850 | $99,320 | $14,000 | $85,320 |
| 2021 | $3,294 | $84,840 | $14,000 | $70,840 |
| 2020 | $2,977 | $76,560 | $10,000 | $66,560 |
| 2019 | $2,994 | $77,000 | $10,000 | $67,000 |
| 2018 | $2,983 | $76,720 | $10,000 | $66,720 |
| 2016 | $2,558 | $65,640 | $8,000 | $57,640 |
| 2015 | $3,020 | $75,360 | $8,000 | $67,360 |
| 2014 | $2,262 | $62,880 | $8,000 | $54,880 |
Property History
| Date | Event | Price | Change | Sq Ft Price |
|---|---|---|---|---|
| 09/12/2025 09/12/25 | Pending | -- | -- | -- |
| 09/01/2025 09/01/25 | Price Changed | $345,000 | -2.8% | $190 / Sq Ft |
| 08/01/2025 08/01/25 | Price Changed | $354,900 | -2.8% | $196 / Sq Ft |
| 07/18/2025 07/18/25 | For Sale | $365,000 | -- | $201 / Sq Ft |
Purchase History
| Date | Type | Sale Price | Title Company |
|---|---|---|---|
| Quit Claim Deed | -- | -- | |
| Warranty Deed | $174,500 | -- | |
| Deed | $217,500 | -- |
Mortgage History
| Date | Status | Loan Amount | Loan Type |
|---|---|---|---|
| Open | $100,374 | New Conventional | |
| Previous Owner | $164,300 | New Conventional | |
| Previous Owner | $171,338 | FHA | |
| Previous Owner | $212,000 | Stand Alone Second | |
| Previous Owner | $206,600 | New Conventional | |
| Previous Owner | $108,500 | Stand Alone Refi Refinance Of Original Loan |
Source: First Multiple Listing Service (FMLS)
MLS Number: 7616064
APN: 032B-01-027-000
Disclaimer: Certain information contained herein is derived from information provided by parties other than Homes.com. All information provided is deemed reliable, but is not guaranteed to be accurate and should be independently verified.
![]() Listings identified with the FMLS IDX logo come from FMLS and are held by brokerage firms other than the owner of this website. The listing brokerage is identified in any listing details. Information is deemed reliable but is not guaranteed. If you believe any FMLS listing contains material that infringes your copyrighted work please visit www.fmls.com/dmca to review our DMCA policy and learn how to submit a takedown request. © 2025 First Multiple Listing Service, Inc.
Listings identified with the FMLS IDX logo come from FMLS and are held by brokerage firms other than the owner of this website. The listing brokerage is identified in any listing details. Information is deemed reliable but is not guaranteed. If you believe any FMLS listing contains material that infringes your copyrighted work please visit www.fmls.com/dmca to review our DMCA policy and learn how to submit a takedown request. © 2025 First Multiple Listing Service, Inc.
- 0 Oak Leaf Dr Unit 10575031
- 0 Oak Leaf Dr Unit M178227
- 50 Oak Leaf Dr
- 10 Brenda Ct
- 125 Oak Leaf Dr
- 20 Lisa Ct
- 4112 Jodeco Rd
- 55 Spivey Chase Ln
- 4081 Jodeco Rd
- 25 Ridgeview Dr
- 145 Meridian Dr
- 257 Turnstone Rd
- 60 Woodland Trace
- 1576 Thornwick Trace
- 1468 Flippen Rd
- 1448 Flippen Rd
- 139 Surge Stone Ln
- 2011 Farm Hill Ct
- 471 Jodeco Ct
- 457 Jodeco Ct