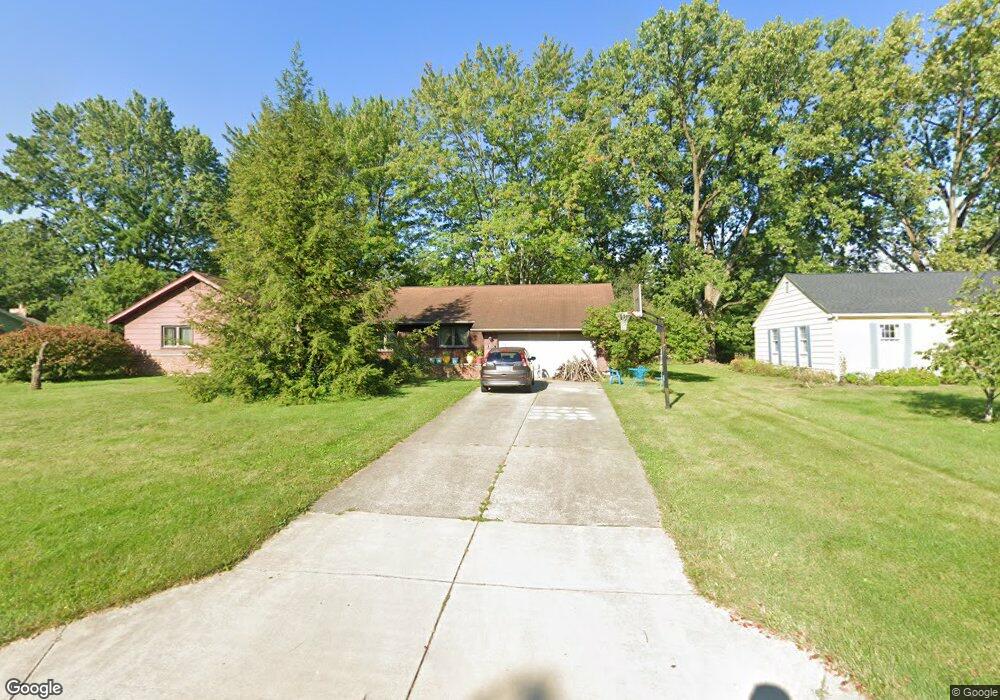
80 Parkwood Ln Oberlin, OH 44074
Estimated Value: $325,488 - $369,000
4
Beds
3
Baths
1,938
Sq Ft
$178/Sq Ft
Est. Value
About This Home
This home is located at 80 Parkwood Ln, Oberlin, OH 44074 and is currently estimated at $344,372, approximately $177 per square foot. 80 Parkwood Ln is a home located in Lorain County with nearby schools including Oberlin Elementary School, Prospect Elementary School, and Langston Middle School.
Ownership History
Date
Name
Owned For
Owner Type
Purchase Details
Closed on
Aug 9, 2008
Sold by
Verda Michael E and Verda Kelly N
Bought by
Haugen Andrew Jason D and Margaris Amy
Current Estimated Value
Home Financials for this Owner
Home Financials are based on the most recent Mortgage that was taken out on this home.
Original Mortgage
$150,800
Outstanding Balance
$99,265
Interest Rate
6.39%
Mortgage Type
Purchase Money Mortgage
Estimated Equity
$245,107
Purchase Details
Closed on
Sep 5, 2001
Sold by
Verda Michael E and Verda Kelly N
Bought by
Verda Michael E and Verda Kelly N
Purchase Details
Closed on
Apr 19, 1999
Sold by
Mittleman Don
Bought by
Verda Michael E and Verda Kelly N
Home Financials for this Owner
Home Financials are based on the most recent Mortgage that was taken out on this home.
Original Mortgage
$112,000
Interest Rate
7.05%
Create a Home Valuation Report for This Property
The Home Valuation Report is an in-depth analysis detailing your home's value as well as a comparison with similar homes in the area
Home Values in the Area
Average Home Value in this Area
Purchase History
| Date | Buyer | Sale Price | Title Company |
|---|---|---|---|
| Haugen Andrew Jason D | $177,500 | Lctc | |
| Verda Michael E | -- | -- | |
| Verda Michael E | $160,000 | Midland Title |
Source: Public Records
Mortgage History
| Date | Status | Borrower | Loan Amount |
|---|---|---|---|
| Open | Haugen Andrew Jason D | $150,800 | |
| Previous Owner | Verda Michael E | $112,000 |
Source: Public Records
Tax History Compared to Growth
Tax History
| Year | Tax Paid | Tax Assessment Tax Assessment Total Assessment is a certain percentage of the fair market value that is determined by local assessors to be the total taxable value of land and additions on the property. | Land | Improvement |
|---|---|---|---|---|
| 2024 | $4,212 | $83,636 | $17,553 | $66,084 |
| 2023 | $3,964 | $70,756 | $16,912 | $53,844 |
| 2022 | $3,860 | $70,756 | $16,912 | $53,844 |
| 2021 | $3,853 | $70,756 | $16,912 | $53,844 |
| 2020 | $3,593 | $62,010 | $14,820 | $47,190 |
| 2019 | $3,552 | $62,010 | $14,820 | $47,190 |
| 2018 | $3,569 | $62,010 | $14,820 | $47,190 |
| 2017 | $3,561 | $63,150 | $15,710 | $47,440 |
| 2016 | $3,597 | $63,150 | $15,710 | $47,440 |
| 2015 | $3,601 | $63,150 | $15,710 | $47,440 |
| 2014 | $3,482 | $59,570 | $14,820 | $44,750 |
| 2013 | $3,424 | $59,570 | $14,820 | $44,750 |
Source: Public Records
Map
Nearby Homes
- 82 Pyle Rd
- 105 S Pyle-Amherst Rd
- 461 W Lorain St
- 457 W Lorain St
- 623 Beech St
- 232 Elm St
- 235 Elm St
- 257 Morgan St
- 149 Morgan St
- 147 Morgan St
- 263 W Lincoln St
- 81 S Professor St
- 121 S Professor St
- 123 S Professor St
- 89 S Professor St
- 44 W Vine St
- 246 W Hamilton St
- 230 N Main St
- 216 N Main St
- 345 N Professor St
- 84 Parkwood Ln
- 76 Parkwood Ln
- 81 Pyle Rd
- 77 Pyle South Amherst Rd
- 85 Pyle South Amherst Rd
- 81 Parkwood Ln
- 73 Pyle South Amherst Rd
- 85 Parkwood Ln
- 88 Parkwood Ln
- 21 Robin Park Blvd
- 89 Pyle South Amherst Rd
- 89 Parkwood Ln
- 69 Pyle South Amherst Rd
- 25 Robin Park Blvd
- 11 Robin Park Blvd
- 82 Pyle South Amherst Rd
- 0 Pyle- S Amherst Rd Unit 3689099
- 86 Pyle Rd
- 92 Glenhurst Dr
- 93 Pyle South Amherst Rd