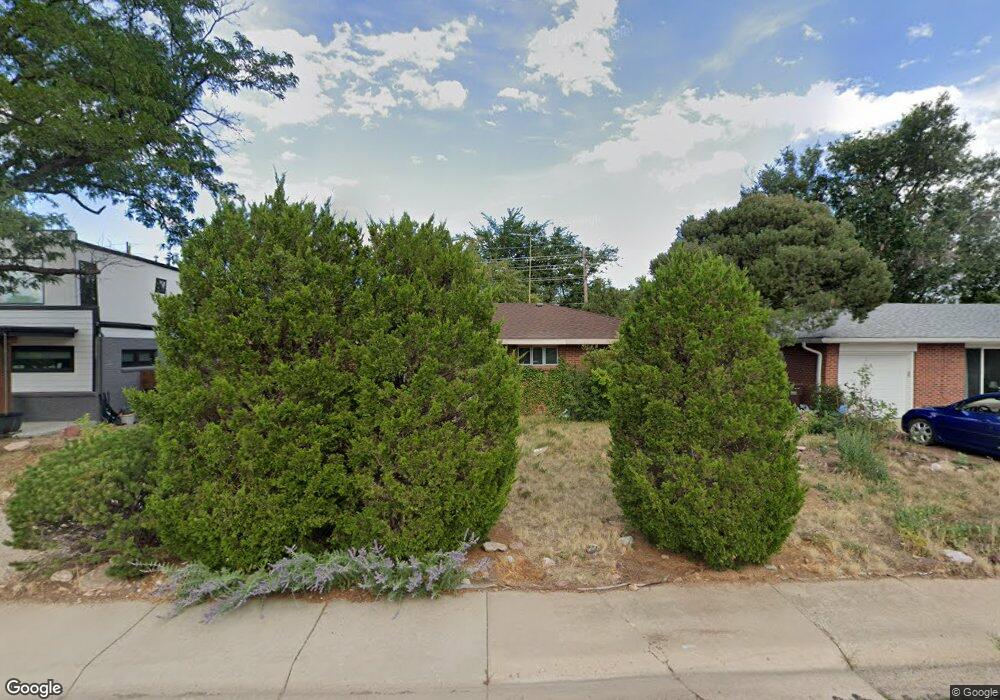
80 S 31st St Boulder, CO 80305
South Boulder NeighborhoodEstimated Value: $615,000 - $770,000
3
Beds
1
Bath
1,026
Sq Ft
$658/Sq Ft
Est. Value
About This Home
This home is located at 80 S 31st St, Boulder, CO 80305 and is currently estimated at $674,645, approximately $657 per square foot. 80 S 31st St is a home located in Boulder County with nearby schools including Creekside Elementary School, Manhattan Middle School of the Arts & Academics, and Fairview High School.
Ownership History
Date
Name
Owned For
Owner Type
Purchase Details
Closed on
Jun 2, 2025
Sold by
Mehta Shirley and Mehta Shirley G
Bought by
Shirleys Place Llc
Current Estimated Value
Purchase Details
Closed on
Apr 8, 2025
Sold by
Mehta Himatlal and Mehta Prakash
Bought by
Beasley Barbara and Mehta Shirley
Purchase Details
Closed on
Jul 27, 2001
Sold by
Risoli Donald Alex and Risoli Kristen Kay
Bought by
Derick Gregory D
Home Financials for this Owner
Home Financials are based on the most recent Mortgage that was taken out on this home.
Original Mortgage
$256,950
Interest Rate
7.07%
Mortgage Type
Balloon
Purchase Details
Closed on
Jul 19, 1971
Bought by
Mehta Shirley G
Create a Home Valuation Report for This Property
The Home Valuation Report is an in-depth analysis detailing your home's value as well as a comparison with similar homes in the area
Home Values in the Area
Average Home Value in this Area
Purchase History
| Date | Buyer | Sale Price | Title Company |
|---|---|---|---|
| Shirleys Place Llc | $620,000 | Land Title Guarantee | |
| Beasley Barbara | -- | None Listed On Document | |
| Derick Gregory D | $285,500 | -- | |
| Mehta Shirley G | $20,000 | -- |
Source: Public Records
Mortgage History
| Date | Status | Borrower | Loan Amount |
|---|---|---|---|
| Previous Owner | Derick Gregory D | $256,950 |
Source: Public Records
Tax History
| Year | Tax Paid | Tax Assessment Tax Assessment Total Assessment is a certain percentage of the fair market value that is determined by local assessors to be the total taxable value of land and additions on the property. | Land | Improvement |
|---|---|---|---|---|
| 2025 | $4,172 | $44,519 | $29,250 | $15,269 |
| 2024 | $4,172 | $44,519 | $29,250 | $15,269 |
| 2023 | $3,521 | $47,470 | $34,411 | $16,743 |
| 2022 | $3,047 | $39,761 | $26,063 | $13,698 |
| 2021 | $2,906 | $40,906 | $26,813 | $14,093 |
| 2020 | $2,706 | $38,232 | $25,812 | $12,420 |
| 2019 | $2,664 | $38,232 | $25,812 | $12,420 |
| 2018 | $2,427 | $35,194 | $23,760 | $11,434 |
| 2017 | $2,351 | $38,908 | $26,268 | $12,640 |
| 2016 | $2,040 | $31,530 | $16,557 | $14,973 |
| 2015 | $1,932 | $25,965 | $13,293 | $12,672 |
| 2014 | $1,514 | $25,965 | $13,293 | $12,672 |
Source: Public Records
Map
Nearby Homes
- 80 S 33rd St
- 3000 Dartmouth Ave
- 3200 Eastman Ave
- 2640 Kohler Dr
- 3505 Moorhead Ave
- 2955 Stanford Ave
- 2585 Kohler Dr
- 3685 Chase Ct
- 345 S 38th St
- 265 S 39th St
- 3805 Martin Dr
- 2795 Vassar Dr
- 375 S 40th St
- 623 Hartford Dr
- 2250 Bluebell Ave
- 245 Fair Place
- 2235 Vassar Dr
- 405 S 43rd St
- 2221 Columbine Ave
- 805 29th St Unit 157
Your Personal Tour Guide
Ask me questions while you tour the home.