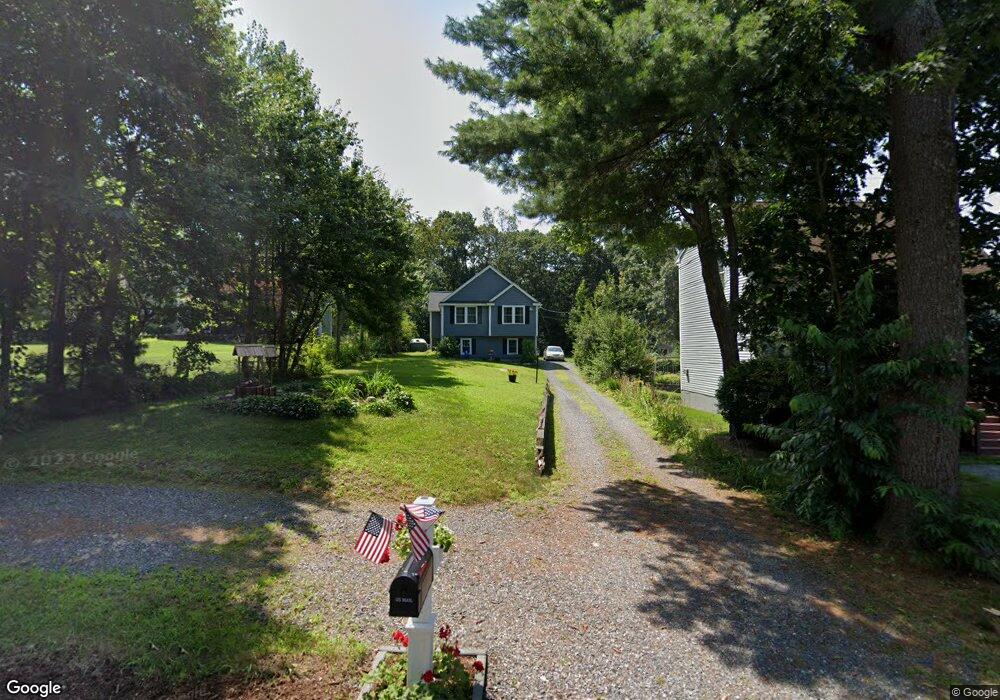
80 Swain Rd Wilmington, MA 01887
Estimated Value: $702,000 - $790,000
4
Beds
1
Bath
1,429
Sq Ft
$521/Sq Ft
Est. Value
About This Home
This home is located at 80 Swain Rd, Wilmington, MA 01887 and is currently estimated at $743,981, approximately $520 per square foot. 80 Swain Rd is a home located in Middlesex County with nearby schools including Wilmington Middle School, Wilmington High School, and Abundant Life Christian School and Childcare.
Ownership History
Date
Name
Owned For
Owner Type
Purchase Details
Closed on
May 11, 2001
Sold by
Deniso Rex A and Deniso Sheryl D
Bought by
Banks Dennis R
Current Estimated Value
Home Financials for this Owner
Home Financials are based on the most recent Mortgage that was taken out on this home.
Original Mortgage
$163,400
Outstanding Balance
$60,335
Interest Rate
6.88%
Mortgage Type
Purchase Money Mortgage
Estimated Equity
$683,646
Purchase Details
Closed on
Mar 26, 1993
Sold by
Letu Roger and Letu Luise
Bought by
Deniso Rex A
Home Financials for this Owner
Home Financials are based on the most recent Mortgage that was taken out on this home.
Original Mortgage
$91,800
Interest Rate
7.73%
Mortgage Type
Purchase Money Mortgage
Create a Home Valuation Report for This Property
The Home Valuation Report is an in-depth analysis detailing your home's value as well as a comparison with similar homes in the area
Home Values in the Area
Average Home Value in this Area
Purchase History
| Date | Buyer | Sale Price | Title Company |
|---|---|---|---|
| Banks Dennis R | $172,000 | -- | |
| Deniso Rex A | $102,000 | -- |
Source: Public Records
Mortgage History
| Date | Status | Borrower | Loan Amount |
|---|---|---|---|
| Open | Deniso Rex A | $163,400 | |
| Previous Owner | Deniso Rex A | $95,500 | |
| Previous Owner | Deniso Rex A | $91,800 |
Source: Public Records
Tax History Compared to Growth
Tax History
| Year | Tax Paid | Tax Assessment Tax Assessment Total Assessment is a certain percentage of the fair market value that is determined by local assessors to be the total taxable value of land and additions on the property. | Land | Improvement |
|---|---|---|---|---|
| 2025 | $7,966 | $695,700 | $301,100 | $394,600 |
| 2024 | $7,863 | $687,900 | $301,100 | $386,800 |
| 2023 | $7,331 | $614,000 | $273,700 | $340,300 |
| 2022 | $7,084 | $543,700 | $228,100 | $315,600 |
| 2021 | $7,290 | $526,700 | $207,300 | $319,400 |
| 2020 | $6,885 | $507,000 | $207,300 | $299,700 |
| 2019 | $6,203 | $451,100 | $197,400 | $253,700 |
| 2018 | $6,222 | $431,800 | $188,100 | $243,700 |
| 2017 | $2,618 | $181,200 | $181,200 | $0 |
| 2016 | $3,924 | $268,200 | $172,600 | $95,600 |
| 2015 | $3,696 | $257,200 | $172,600 | $84,600 |
| 2014 | $3,446 | $242,000 | $164,300 | $77,700 |
Source: Public Records
Map
Nearby Homes
- 82 Swain Rd
- 78 Swain Rd
- 59 Forest St Unit A
- 59 Forest St Unit A
- 59 Forest St Unit B
- 59 Forest St Unit 59 B
- 59A Forest St
- 57 Forest St
- 61 Forest St
- 84 Swain Rd
- 75 Swain Rd
- 77 Swain Rd
- 77 Swain Rd Unit 1
- 77 Swain Rd Unit 77
- 76 Swain Rd
- 63 Forest St
- 56 Forest St
- 39 Roosevelt Rd
- 58 Forest St
- 51 Forest St