Estimated Value: $583,000 - $641,000
4
Beds
3
Baths
2,464
Sq Ft
$248/Sq Ft
Est. Value
About This Home
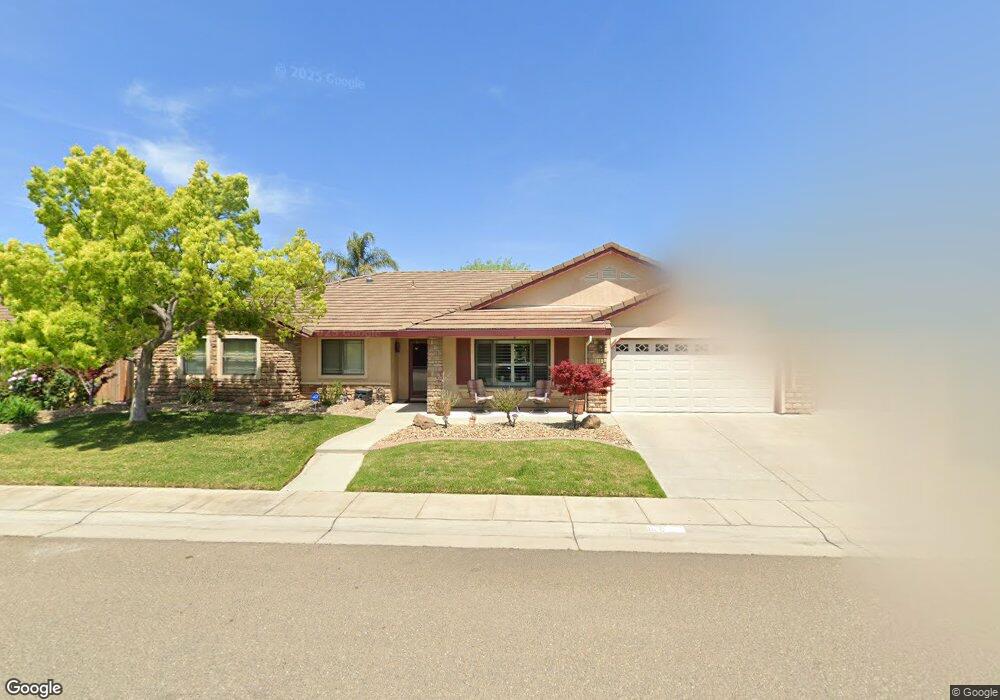
This home is located at 800 Buttercup Cir, Galt, CA 95632 and is currently estimated at $612,289, approximately $248 per square foot. 800 Buttercup Cir is a home located in Sacramento County with nearby schools including River Oaks Elementary School, Robert L. McCaffrey Middle School, and Liberty Ranch High School.
Ownership History
Date
Name
Owned For
Owner Type
Purchase Details
Closed on
Jul 20, 2020
Sold by
Berry Alex and Berry Deborah Ann
Bought by
Berry Alex and Berry Deborah Ann
Current Estimated Value
Home Financials for this Owner
Home Financials are based on the most recent Mortgage that was taken out on this home.
Original Mortgage
$413,000
Outstanding Balance
$366,901
Interest Rate
3.2%
Mortgage Type
New Conventional
Estimated Equity
$245,388
Purchase Details
Closed on
Apr 30, 2018
Sold by
Berry Alex and Berry Deborah A
Bought by
Berry Alex and Berry Deborah Ann
Purchase Details
Closed on
Mar 18, 2005
Sold by
Emerald Park Co
Bought by
Berry Alex and Berry Deborah A
Home Financials for this Owner
Home Financials are based on the most recent Mortgage that was taken out on this home.
Original Mortgage
$259,000
Interest Rate
5%
Mortgage Type
Purchase Money Mortgage
Create a Home Valuation Report for This Property
The Home Valuation Report is an in-depth analysis detailing your home's value as well as a comparison with similar homes in the area
Home Values in the Area
Average Home Value in this Area
Purchase History
| Date | Buyer | Sale Price | Title Company |
|---|---|---|---|
| Berry Alex | -- | First American Title Company | |
| Berry Alex | -- | First American Title Company | |
| Berry Alex | -- | None Available | |
| Berry Alex | $370,000 | Fidelity National Title Co |
Source: Public Records
Mortgage History
| Date | Status | Borrower | Loan Amount |
|---|---|---|---|
| Open | Berry Alex | $413,000 | |
| Closed | Berry Alex | $259,000 | |
| Closed | Berry Alex | $111,000 |
Source: Public Records
Tax History
| Year | Tax Paid | Tax Assessment Tax Assessment Total Assessment is a certain percentage of the fair market value that is determined by local assessors to be the total taxable value of land and additions on the property. | Land | Improvement |
|---|---|---|---|---|
| 2025 | $5,818 | $515,727 | $139,378 | $376,349 |
| 2024 | $5,818 | $505,616 | $136,646 | $368,970 |
| 2023 | $6,282 | $495,703 | $133,967 | $361,736 |
| 2022 | $6,057 | $485,985 | $131,341 | $354,644 |
| 2021 | $6,064 | $476,457 | $128,766 | $347,691 |
| 2020 | $6,019 | $471,572 | $127,446 | $344,126 |
| 2019 | $5,887 | $462,327 | $124,948 | $337,379 |
| 2018 | $5,800 | $453,263 | $122,499 | $330,764 |
| 2017 | $5,598 | $444,377 | $120,098 | $324,279 |
| 2016 | $5,150 | $410,340 | $110,900 | $299,440 |
| 2015 | $5,215 | $394,559 | $106,635 | $287,924 |
| 2014 | $4,873 | $355,459 | $96,068 | $259,391 |
Source: Public Records
Map
Nearby Homes
- 787 Twin Hills Dr
- 954 Port Ashton Ct
- 733 Prairie Ct
- 876 Cobden Way
- 859 Pecan Tree Ln
- 863 Pecan Tree Ln
- 856 Pecan Tree Ln
- 867 Pecan Tree Ln
- 854 Pecan Tree Ln
- 872 Pecan Tree Ln
- 692 Arlene Ct
- 846 Cedar Canyon Cir
- 764 Adare Way
- 975 Rossburn Way
- 763 Adare Way
- 988 Padbury Ct
- 724 Adare Way
- 914 Cedar Canyon Cir
- 707 Summit Lakes Way
- 968 Posey St
- 796 Buttercup Cir
- 804 Buttercup Cir
- 795 Buttercup Cir
- 799 Buttercup Cir
- 808 Buttercup Cir
- 792 Buttercup Cir
- 787 Buttercup Cir
- 790 Twin Hills Dr
- 786 Twin Hills Dr
- 803 Buttercup Cir
- 782 Twin Hills Dr
- 783 Buttercup Cir
- 778 Twin Hills Dr
- 812 Buttercup Cir
- 794 Twin Hills Dr
- 771 Buttercup Cir
- 788 Buttercup Cir
- 807 Buttercup Cir
- 767 Buttercup Cir
- 774 Twin Hills Dr
Your Personal Tour Guide
Ask me questions while you tour the home.