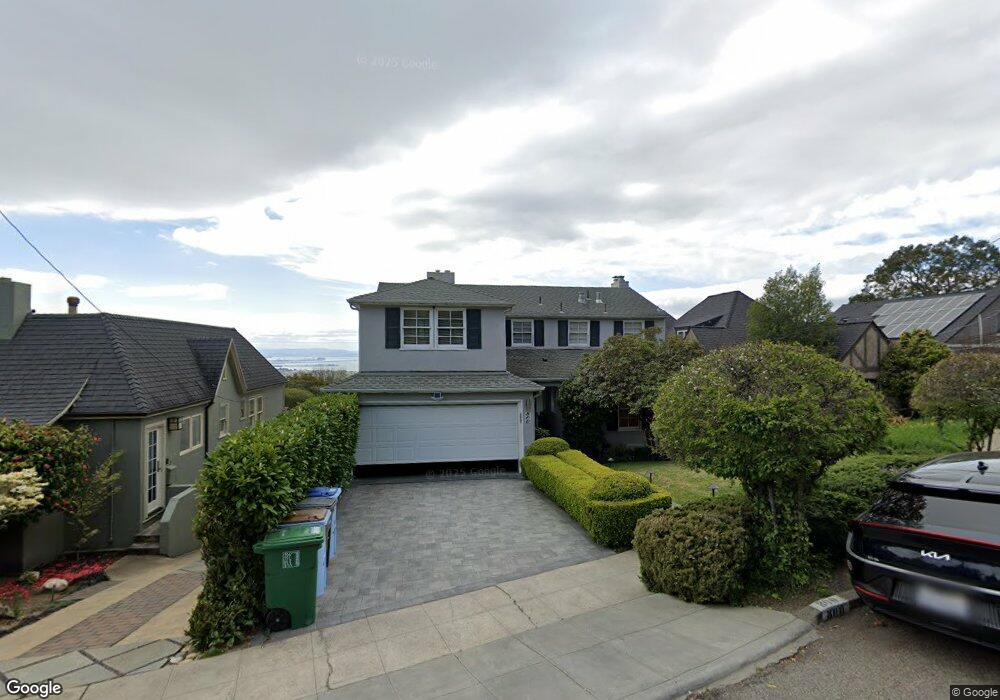
800 Cragmont Ave Berkeley, CA 94708
Berkeley Hills NeighborhoodEstimated Value: $2,489,000 - $2,892,000
5
Beds
4
Baths
3,224
Sq Ft
$826/Sq Ft
Est. Value
About This Home
This home is located at 800 Cragmont Ave, Berkeley, CA 94708 and is currently estimated at $2,664,164, approximately $826 per square foot. 800 Cragmont Ave is a home located in Alameda County with nearby schools including Cragmont Elementary School, Berkeley Arts Magnet at Whittier School, and Washington Elementary School.
Ownership History
Date
Name
Owned For
Owner Type
Purchase Details
Closed on
May 23, 2017
Sold by
Pachter Lior S and Hallgrimsdottir Ingileif Bryndis
Bought by
Machado Pereira Monisha and Pereira Rohit
Current Estimated Value
Home Financials for this Owner
Home Financials are based on the most recent Mortgage that was taken out on this home.
Original Mortgage
$1,515,000
Outstanding Balance
$1,259,218
Interest Rate
4.08%
Mortgage Type
New Conventional
Estimated Equity
$1,404,946
Purchase Details
Closed on
Feb 26, 2009
Sold by
Bingham Judith A and The Harry H & Judith A Bingham
Bought by
Pachter Lior S and Hallgrimsdottir Ingileif Bryndis
Home Financials for this Owner
Home Financials are based on the most recent Mortgage that was taken out on this home.
Original Mortgage
$625,000
Interest Rate
4.91%
Mortgage Type
Purchase Money Mortgage
Purchase Details
Closed on
Jul 2, 1997
Sold by
Bingham Harry H & Judith A Living Trust and Judith A
Bought by
Bingham Judith A H and Bingham Harry H
Create a Home Valuation Report for This Property
The Home Valuation Report is an in-depth analysis detailing your home's value as well as a comparison with similar homes in the area
Home Values in the Area
Average Home Value in this Area
Purchase History
| Date | Buyer | Sale Price | Title Company |
|---|---|---|---|
| Machado Pereira Monisha | $2,165,000 | Fidelity National Title Co | |
| Pachter Lior S | $1,250,000 | Placer Title Company | |
| Bingham Judith A H | -- | -- |
Source: Public Records
Mortgage History
| Date | Status | Borrower | Loan Amount |
|---|---|---|---|
| Open | Machado Pereira Monisha | $1,515,000 | |
| Previous Owner | Pachter Lior S | $625,000 |
Source: Public Records
Tax History
| Year | Tax Paid | Tax Assessment Tax Assessment Total Assessment is a certain percentage of the fair market value that is determined by local assessors to be the total taxable value of land and additions on the property. | Land | Improvement |
|---|---|---|---|---|
| 2025 | $35,166 | $2,505,612 | $638,308 | $1,874,304 |
| 2024 | $35,166 | $2,456,358 | $625,795 | $1,837,563 |
| 2023 | $34,473 | $2,415,057 | $613,525 | $1,801,532 |
| 2022 | $33,930 | $2,360,708 | $601,496 | $1,766,212 |
| 2021 | $34,068 | $2,314,290 | $589,704 | $1,731,586 |
| 2020 | $32,391 | $2,297,498 | $583,660 | $1,713,838 |
| 2019 | $31,292 | $2,252,466 | $572,220 | $1,680,246 |
| 2018 | $30,814 | $2,208,300 | $561,000 | $1,647,300 |
| 2017 | $20,835 | $1,418,437 | $416,077 | $1,002,360 |
| 2016 | $20,171 | $1,390,632 | $407,921 | $982,711 |
| 2015 | $19,903 | $1,369,755 | $401,797 | $967,958 |
| 2014 | $19,713 | $1,342,934 | $393,930 | $949,004 |
Source: Public Records
Map
Nearby Homes
- 770 Santa Barbara Rd
- 826 Indian Rock Ave
- 614 Cragmont Ave
- 1024 Miller Ave
- 935 Grizzly Peak Blvd
- 982 Grizzly Peak Blvd
- 582 Euclid Ave
- 1983 Yosemite Rd
- 479 Kentucky Ave
- 1106 Cragmont Ave
- 549 Santa Barbara Rd
- 483 Boynton Ave
- 1136 Keith Ave
- 385 Vermont Ave
- 1165 Cragmont Ave
- 1119 Miller Ave
- 1110 Sterling Ave
- 1123 Park Hills Rd
- 255 Stanford Ave
- 265 Purdue Ave
- 814 Cragmont Ave
- 796 Cragmont Ave
- 824 Cragmont Ave
- 792 Cragmont Ave
- 836 Cragmont Ave
- 803 Regal Rd
- 790 Cragmont Ave
- 801 Regal Rd
- 809 Cragmont Ave
- 793 Cragmont Ave
- 801 Cragmont Ave
- 819 Cragmont Ave
- 781 Spruce St
- 825 Cragmont Ave
- 785 Cragmont Ave
- 851 Regal Rd
- 861 Regal Rd
- 809 Regal Rd
- 1 Rock Ln
- 841 Regal Rd
Your Personal Tour Guide
Ask me questions while you tour the home.