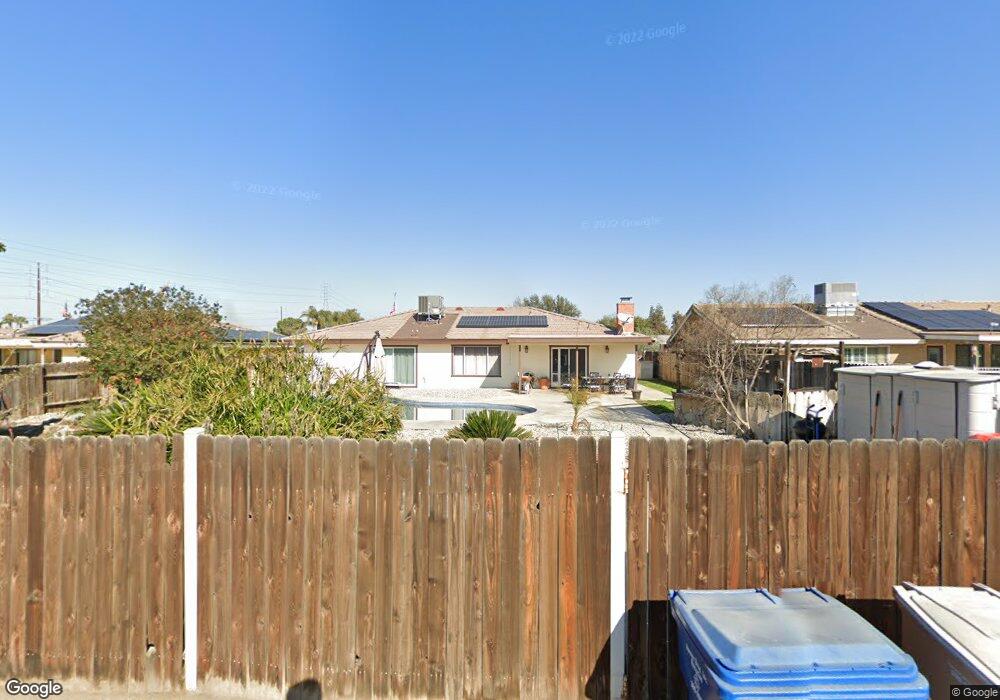
8001 Debbs Ave Bakersfield, CA 93308
Olive Drive Area NeighborhoodEstimated Value: $442,000 - $478,000
3
Beds
2
Baths
1,793
Sq Ft
$253/Sq Ft
Est. Value
About This Home
This home is located at 8001 Debbs Ave, Bakersfield, CA 93308 and is currently estimated at $453,735, approximately $253 per square foot. 8001 Debbs Ave is a home located in Kern County with nearby schools including Olive Drive Elementary School, Norris Middle School, and Centennial High School.
Ownership History
Date
Name
Owned For
Owner Type
Purchase Details
Closed on
Aug 5, 2015
Sold by
Clevenger Lonnie J
Bought by
Clevenger James
Current Estimated Value
Home Financials for this Owner
Home Financials are based on the most recent Mortgage that was taken out on this home.
Original Mortgage
$245,471
Outstanding Balance
$192,005
Interest Rate
3.87%
Mortgage Type
FHA
Estimated Equity
$261,730
Purchase Details
Closed on
Dec 20, 2013
Sold by
Clevenger Lonnie J and Clevenger Briana Michelle
Bought by
Clevenger Lonnie J
Home Financials for this Owner
Home Financials are based on the most recent Mortgage that was taken out on this home.
Original Mortgage
$200,000
Interest Rate
4.32%
Mortgage Type
New Conventional
Purchase Details
Closed on
Dec 7, 2011
Sold by
Clevenger Lonnie J
Bought by
Clevenger Lonnie J and Clevenger Briana Michelle
Home Financials for this Owner
Home Financials are based on the most recent Mortgage that was taken out on this home.
Original Mortgage
$184,208
Interest Rate
4.25%
Mortgage Type
FHA
Purchase Details
Closed on
Oct 17, 2011
Sold by
Wilson Keith Lee and Wilson Anita Lynn
Bought by
Clevenger Lonnie J
Home Financials for this Owner
Home Financials are based on the most recent Mortgage that was taken out on this home.
Original Mortgage
$184,208
Interest Rate
4.25%
Mortgage Type
FHA
Create a Home Valuation Report for This Property
The Home Valuation Report is an in-depth analysis detailing your home's value as well as a comparison with similar homes in the area
Home Values in the Area
Average Home Value in this Area
Purchase History
| Date | Buyer | Sale Price | Title Company |
|---|---|---|---|
| Clevenger James | $250,000 | Placer Title Company | |
| Clevenger Lonnie J | -- | Lawyers Title | |
| Clevenger Lonnie J | -- | None Available | |
| Clevenger Lonnie J | $189,500 | Ticor Title Company Of Ca | |
| Clevenger Lonnie J | -- | Ticor Title Company Of Ca |
Source: Public Records
Mortgage History
| Date | Status | Borrower | Loan Amount |
|---|---|---|---|
| Open | Clevenger James | $245,471 | |
| Closed | Clevenger Lonnie J | $200,000 | |
| Closed | Clevenger Lonnie J | $184,208 |
Source: Public Records
Tax History
| Year | Tax Paid | Tax Assessment Tax Assessment Total Assessment is a certain percentage of the fair market value that is determined by local assessors to be the total taxable value of land and additions on the property. | Land | Improvement |
|---|---|---|---|---|
| 2025 | $3,926 | $295,941 | $71,024 | $224,917 |
| 2024 | $3,849 | $290,139 | $69,632 | $220,507 |
| 2023 | $3,849 | $284,451 | $68,267 | $216,184 |
| 2022 | $3,776 | $278,875 | $66,929 | $211,946 |
| 2021 | $3,689 | $273,408 | $65,617 | $207,791 |
| 2020 | $3,583 | $270,606 | $64,945 | $205,661 |
| 2019 | $3,531 | $270,606 | $64,945 | $205,661 |
| 2018 | $3,416 | $260,100 | $62,424 | $197,676 |
| 2017 | $3,430 | $255,000 | $61,200 | $193,800 |
| 2016 | $3,194 | $250,000 | $60,000 | $190,000 |
| 2015 | $2,660 | $197,522 | $41,803 | $155,719 |
| 2014 | $2,587 | $193,654 | $40,985 | $152,669 |
Source: Public Records
Map
Nearby Homes
- 8031 Debbs Ave
- 7702 Davin Park Dr
- 8105 Mossrock Dr
- 7503 Olive Dr
- 7809 Carol Sue Ct
- 5433 Westpark St
- 7605 Penny Marie Ave
- 8510 Mainsail Dr
- 7908 Jill Jean Ave
- 5216 Westpark St
- 6413 Gina Ct
- 8509 Nine Iron Dr
- 7704 Jill Jean Ave
- 7200 Darrin Ave
- 6017 Lakewood Shores Dr
- 8312 Exodus Ln
- 8118 Whitewater Dr
- 7625 Weldon Ave
- 8707 Shore View Dr
- 6008 Eugene Place
Your Personal Tour Guide
Ask me questions while you tour the home.