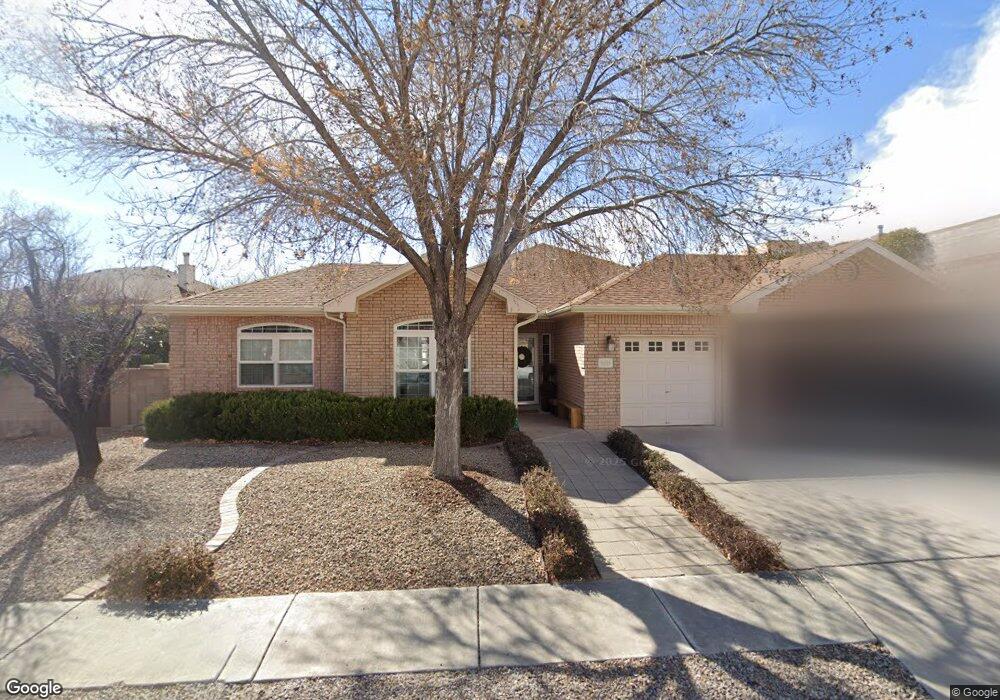
8009 Harrisonburg Ct NW Albuquerque, NM 87120
Taylor Ranch NeighborhoodEstimated Value: $420,000 - $495,000
3
Beds
2
Baths
1,870
Sq Ft
$245/Sq Ft
Est. Value
About This Home
This home is located at 8009 Harrisonburg Ct NW, Albuquerque, NM 87120 and is currently estimated at $458,289, approximately $245 per square foot. 8009 Harrisonburg Ct NW is a home located in Bernalillo County with nearby schools including Chamiza Elementary School, L.B. Johnson Middle School, and Volcano Vista High School.
Ownership History
Date
Name
Owned For
Owner Type
Purchase Details
Closed on
Dec 7, 2012
Sold by
Bank Of Oklahoma Financial Na
Bought by
Federal Home Loan Mortgage Corporation
Current Estimated Value
Purchase Details
Closed on
May 15, 2008
Sold by
Brown Joshua A and Brown Deanna M
Bought by
Brown Deanna M and Brown Joshua M
Home Financials for this Owner
Home Financials are based on the most recent Mortgage that was taken out on this home.
Original Mortgage
$306,000
Interest Rate
5.89%
Mortgage Type
Stand Alone Refi Refinance Of Original Loan
Purchase Details
Closed on
Aug 11, 2005
Sold by
Snyder Lewise
Bought by
Brown Joshua M and Brown Deanna M
Home Financials for this Owner
Home Financials are based on the most recent Mortgage that was taken out on this home.
Original Mortgage
$179,920
Interest Rate
5.51%
Mortgage Type
Fannie Mae Freddie Mac
Purchase Details
Closed on
May 27, 2005
Sold by
Lindsey Dortha Ruth
Bought by
Snyder Lewise and Ruth Lindsey Family Trust
Create a Home Valuation Report for This Property
The Home Valuation Report is an in-depth analysis detailing your home's value as well as a comparison with similar homes in the area
Home Values in the Area
Average Home Value in this Area
Purchase History
| Date | Buyer | Sale Price | Title Company |
|---|---|---|---|
| Federal Home Loan Mortgage Corporation | -- | None Available | |
| Brown Deanna M | -- | Landamerica Albuquerque Titl | |
| Brown Joshua M | -- | Fidelity Natl Title Ins Co | |
| Snyder Lewise | -- | -- |
Source: Public Records
Mortgage History
| Date | Status | Borrower | Loan Amount |
|---|---|---|---|
| Previous Owner | Brown Deanna M | $306,000 | |
| Previous Owner | Brown Joshua M | $179,920 |
Source: Public Records
Tax History Compared to Growth
Tax History
| Year | Tax Paid | Tax Assessment Tax Assessment Total Assessment is a certain percentage of the fair market value that is determined by local assessors to be the total taxable value of land and additions on the property. | Land | Improvement |
|---|---|---|---|---|
| 2025 | $3,726 | $93,031 | $15,094 | $77,937 |
| 2024 | $3,726 | $90,321 | $14,654 | $75,667 |
| 2023 | $3,662 | $87,692 | $14,228 | $73,464 |
| 2022 | $3,536 | $85,137 | $13,813 | $71,324 |
| 2021 | $3,415 | $82,658 | $13,411 | $69,247 |
| 2020 | $3,356 | $80,250 | $13,020 | $67,230 |
| 2019 | $3,255 | $77,913 | $12,641 | $65,272 |
| 2018 | $3,137 | $77,913 | $12,641 | $65,272 |
| 2017 | $3,038 | $75,644 | $12,273 | $63,371 |
| 2016 | $2,949 | $71,303 | $11,569 | $59,734 |
| 2015 | $69,226 | $69,226 | $11,232 | $57,994 |
| 2014 | $2,779 | $67,446 | $10,262 | $57,184 |
| 2013 | -- | $65,481 | $9,963 | $55,518 |
Source: Public Records
Map
Nearby Homes
- 4600 Waynesboro Place NW
- 4515 Millwood Ct NW
- 4512 Waynesboro Rd NW
- 7824 Snowberry St NW
- 4820 Summersville Dr NW
- 7809 Juneberry St NW
- 7939 Independence Dr NW
- 7739 Ridgeview Dr NW
- 7708 Ridgeview Dr NW
- 4309 Rancho Largo Rd NW
- 7516 Wells Fargo Trail NW
- 4320 La Paloma Rd NW
- 7532 Deerfield Rd NW
- 7432 Primrose Dr NW
- 4500 Samara Rd NW
- 7557 Richmond Hill Rd NW
- 7434 Riverton Dr NW
- 5136 Roanoke Ave NW
- 4612 Lobelia Rd NW
- 8100 Rancho Viejo Ct NW
- 4619 Waynesboro Place NW
- 4611 Waynesboro Place NW
- 4615 Waynesboro Place NW
- 8012 Harrisonburg Ct NW
- 8008 Harrisonburg Ct NW
- 4708 Lewisburg Ct NW
- 4623 Waynesboro Place NW
- 8004 Harrisonburg Ct NW
- 8016 Harrisonburg Ct NW
- 4712 Lewisburg Ct NW
- 4701 Lewisburg Ct NW
- 8000 Harrisonburg Ct NW
- 4616 Waynesboro Place NW
- 8112 Lewisburg Dr NW
- 4612 Waynesboro Place NW
- 4620 Waynesboro Place NW
- 4608 Waynesboro Place NW
- 4716 Lewisburg Ct NW
- 8108 Lewisburg Dr NW
- 4624 Waynesboro Place NW