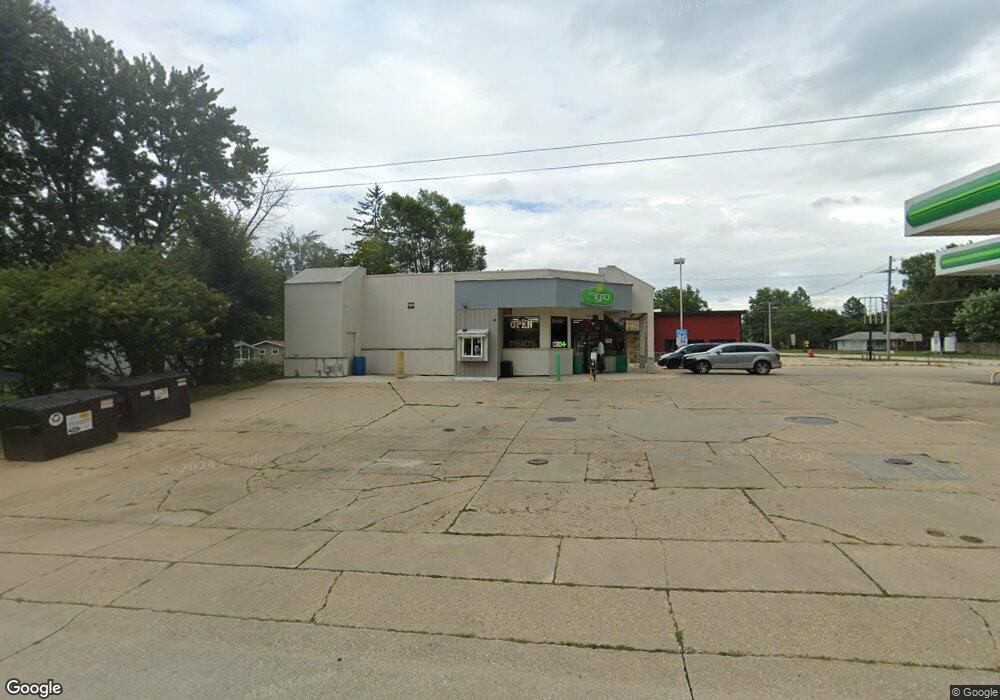
801 E Charles St Oelwein, IA 50662
Estimated Value: $389,901
--
Bed
--
Bath
2,322
Sq Ft
$168/Sq Ft
Est. Value
About This Home
This home is located at 801 E Charles St, Oelwein, IA 50662 and is currently estimated at $389,901, approximately $167 per square foot. 801 E Charles St is a home located in Fayette County with nearby schools including Little Husky Learning Center, Wings Park Elementary School, and Parkside Elementary School.
Ownership History
Date
Name
Owned For
Owner Type
Purchase Details
Closed on
Jul 1, 2022
Sold by
H & S Stores Llc
Bought by
J & S 786 Llc
Current Estimated Value
Home Financials for this Owner
Home Financials are based on the most recent Mortgage that was taken out on this home.
Original Mortgage
$400,000
Outstanding Balance
$380,554
Interest Rate
5.09%
Mortgage Type
New Conventional
Estimated Equity
$9,347
Purchase Details
Closed on
Aug 23, 2017
Sold by
Kana Llc
Bought by
Krish Management Corportation
Purchase Details
Closed on
Sep 3, 2014
Sold by
Shanidev Llc
Bought by
Kana Llc
Create a Home Valuation Report for This Property
The Home Valuation Report is an in-depth analysis detailing your home's value as well as a comparison with similar homes in the area
Home Values in the Area
Average Home Value in this Area
Purchase History
| Date | Buyer | Sale Price | Title Company |
|---|---|---|---|
| J & S 786 Llc | $325,000 | None Listed On Document | |
| Krish Management Corportation | $512,000 | None Available | |
| Kana Llc | $96,500 | None Available |
Source: Public Records
Mortgage History
| Date | Status | Borrower | Loan Amount |
|---|---|---|---|
| Open | J & S 786 Llc | $400,000 |
Source: Public Records
Tax History Compared to Growth
Tax History
| Year | Tax Paid | Tax Assessment Tax Assessment Total Assessment is a certain percentage of the fair market value that is determined by local assessors to be the total taxable value of land and additions on the property. | Land | Improvement |
|---|---|---|---|---|
| 2024 | $6,732 | $254,220 | $51,510 | $202,710 |
| 2023 | $5,458 | $254,220 | $51,510 | $202,710 |
| 2022 | $4,060 | $213,930 | $40,180 | $173,750 |
| 2021 | $4,060 | $245,180 | $51,510 | $193,670 |
| 2020 | $5,550 | $245,180 | $51,510 | $193,670 |
| 2019 | $4,766 | $215,910 | $0 | $0 |
| 2018 | $4,658 | $215,910 | $0 | $0 |
| 2017 | $4,320 | $191,070 | $0 | $0 |
| 2016 | $4,522 | $205,020 | $0 | $0 |
| 2015 | $4,522 | $0 | $0 | $0 |
| 2014 | $6,818 | $0 | $0 | $0 |
Source: Public Records
Map
Nearby Homes
- 0 Elmwood Pkwy
- 45 7th Ave SE
- 5 Hillside Dr E
- 100 Hillside Dr W
- 100 7th Ave SE
- 13 Hillside Dr E
- 120 12th Ave NE
- 107 5th Ave SE
- 1312 3rd St NE
- 1204 3rd St NE
- 1108 3rd St NE
- 40 5th Ave SE
- 1213 Elm St
- 1215 3rd St NE
- 300 6th Ave SE
- 524 8th Ave NE
- 219 2nd Ave NE
- 420 Lincoln Dr
- 418 7th Ave SE
- 215 1st Ave NE