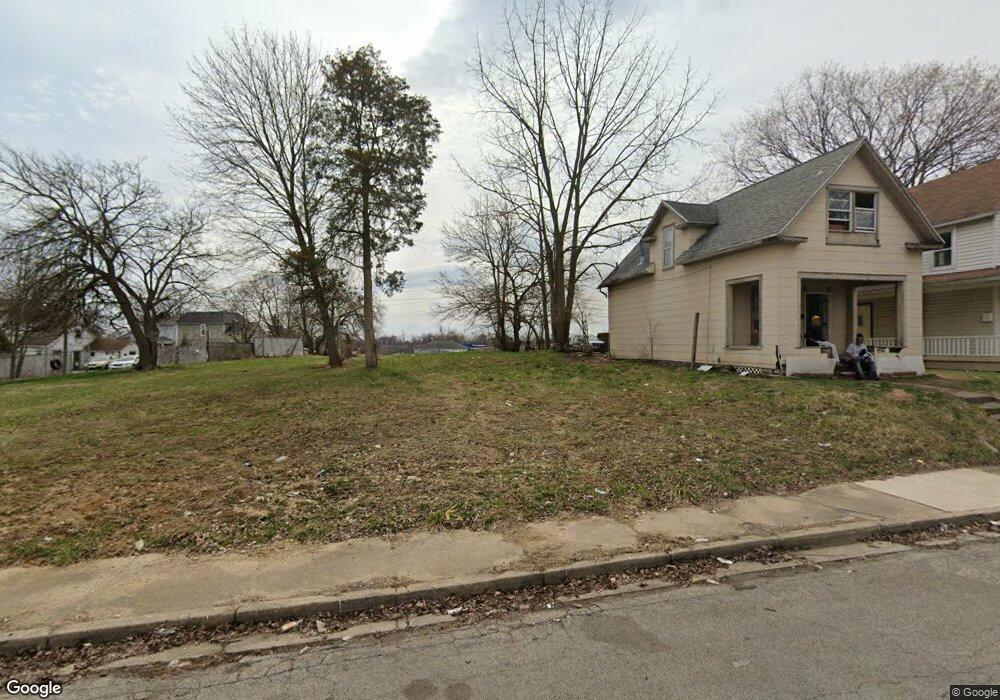
801 Summer St Springfield, OH 45505
Estimated Value: $45,602 - $180,000
2
Beds
1
Bath
1,408
Sq Ft
$74/Sq Ft
Est. Value
About This Home
This home is located at 801 Summer St, Springfield, OH 45505 and is currently estimated at $104,651, approximately $74 per square foot. 801 Summer St is a home located in Clark County with nearby schools including Kenwood Elementary School, Hayward Middle School, and Springfield High School.
Ownership History
Date
Name
Owned For
Owner Type
Purchase Details
Closed on
Mar 25, 2004
Sold by
Johnson Rex A and Johnson Kimberly S
Bought by
Caudill John H
Current Estimated Value
Home Financials for this Owner
Home Financials are based on the most recent Mortgage that was taken out on this home.
Original Mortgage
$34,459
Outstanding Balance
$15,711
Interest Rate
5.65%
Mortgage Type
FHA
Estimated Equity
$88,940
Purchase Details
Closed on
Sep 24, 2002
Sold by
Manufacturers & Traders Trust Company
Bought by
Johnson Rex A and Johnson Kimberly S
Purchase Details
Closed on
Jun 21, 2002
Sold by
Edith Knight
Bought by
Manufacturers & Traders Trust Company
Create a Home Valuation Report for This Property
The Home Valuation Report is an in-depth analysis detailing your home's value as well as a comparison with similar homes in the area
Home Values in the Area
Average Home Value in this Area
Purchase History
| Date | Buyer | Sale Price | Title Company |
|---|---|---|---|
| Caudill John H | $35,000 | -- | |
| Johnson Rex A | $10,000 | -- | |
| Manufacturers & Traders Trust Company | $10,700 | -- |
Source: Public Records
Mortgage History
| Date | Status | Borrower | Loan Amount |
|---|---|---|---|
| Open | Caudill John H | $34,459 |
Source: Public Records
Tax History
| Year | Tax Paid | Tax Assessment Tax Assessment Total Assessment is a certain percentage of the fair market value that is determined by local assessors to be the total taxable value of land and additions on the property. | Land | Improvement |
|---|---|---|---|---|
| 2025 | $10,950 | $980 | $980 | -- |
| 2024 | $20,492 | $830 | $830 | -- |
| 2023 | $10,255 | $830 | $830 | $0 |
| 2022 | $19,416 | $830 | $830 | $0 |
| 2021 | $38 | $700 | $700 | $0 |
| 2020 | $3,702 | $700 | $700 | $0 |
| 2019 | $3,703 | $700 | $700 | $0 |
| 2018 | $433 | $7,740 | $1,400 | $6,340 |
| 2017 | $433 | $7,739 | $1,404 | $6,335 |
| 2016 | $433 | $7,739 | $1,404 | $6,335 |
| 2015 | $502 | $8,789 | $1,404 | $7,385 |
| 2014 | $499 | $8,789 | $1,404 | $7,385 |
| 2013 | $494 | $8,789 | $1,404 | $7,385 |
Source: Public Records
Map
Nearby Homes
- 705 York St
- 453 E Pleasant St
- 1008 Tibbetts Ave
- 652 E Southern Ave
- 650 E Southern Ave
- 1111 Lafayette Ave
- 418 Linden Ave
- 908 Pine St
- 1318 Maryland Ave
- 638 Clifton Ave
- 550 E Rose St
- 1247 Selma Rd
- 1215 E High St
- 360 S Greenmount Ave
- 1213 Gable St
- 205 E Grand Ave
- 1202-1204 Clifton Ave
- 1202 Clifton Ave
- 321 Glenn Ave
- 1519 Tibbetts Ave