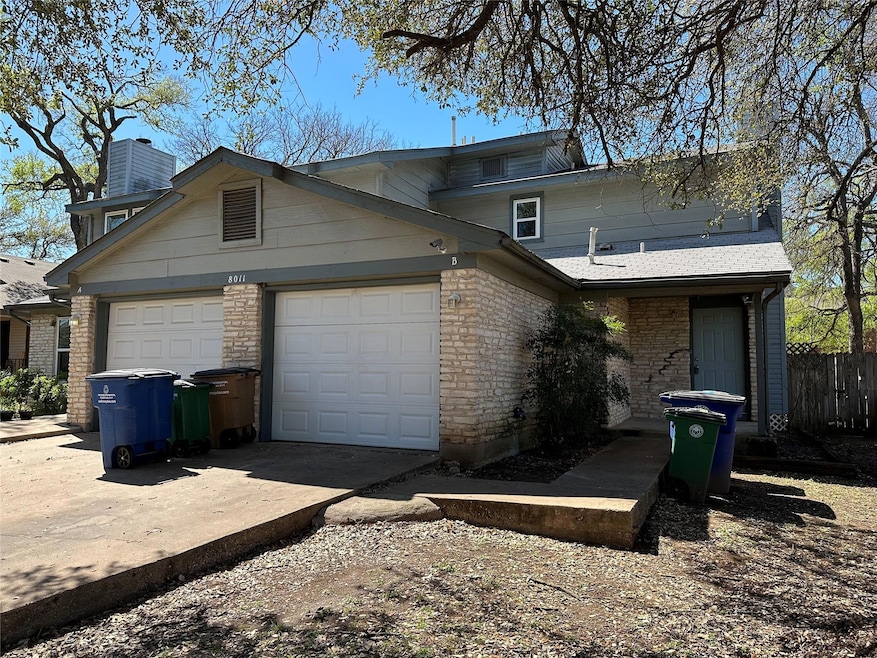
8011 Tuscarora Trail Unit B Austin, TX 78729
Anderson Mill NeighborhoodHighlights
- Vaulted Ceiling
- Private Yard
- 1 Car Attached Garage
- Pond Springs Elementary School Rated A-
- No HOA
- Double Pane Windows
About This Home
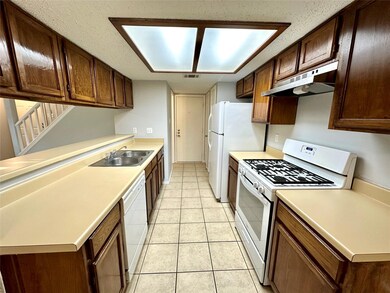
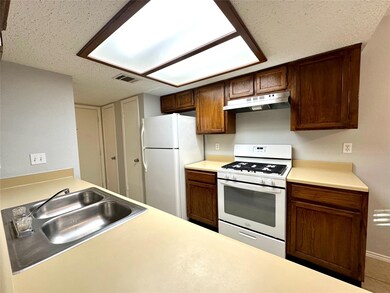
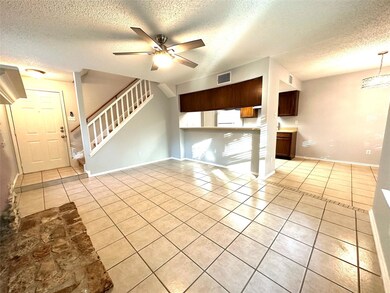
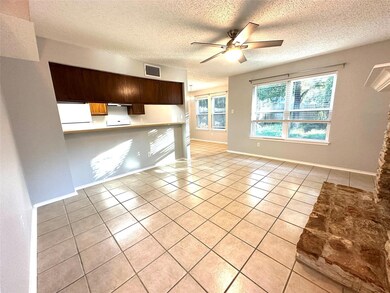
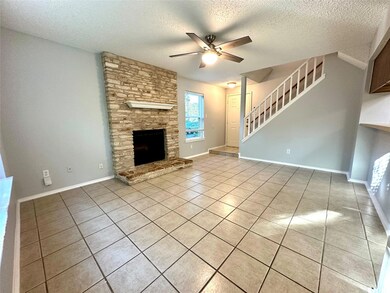
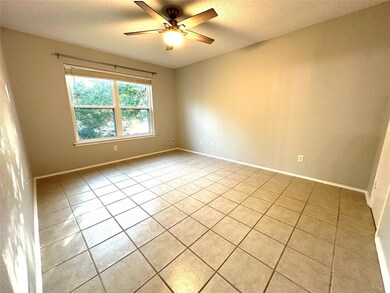
Well maintained duplex in North Austin Milwood neighborhood featuring Updated bathrooms, large bedrooms, new windows, new fans and fixtures, new paint, one car garage with remote opener, Private Fenced Yard, Tiles Floors, decorative fireplace, recent refrigerator, dishwasher, stove. Tree shaded lot on a quiet street with easy access to 183 and Mopac, and close to The Domain, Apple campus, and other Austin tech employers. Available ASAP Great Round Rock Schools. *MINIMUM CREDIT SCORE OF 600, STRONG RENTAL HISTORY, AND VERIFIABLE INCOME OF AT LEAST 3 TIMES THE RENT.*
Listing Agent
Central Metro Realty Brokerage Phone: (512) 699-3940 License #0484371 Listed on: 09/07/2025

Property Details
Home Type
- Multi-Family
Est. Annual Taxes
- $10,290
Year Built
- Built in 1985
Lot Details
- 8,625 Sq Ft Lot
- Northeast Facing Home
- Fenced
- Many Trees
- Private Yard
Parking
- 1 Car Attached Garage
- Front Facing Garage
- Single Garage Door
- Off-Street Parking
Home Design
- Duplex
- Slab Foundation
- Composition Roof
- Masonry Siding
Interior Spaces
- 1,050 Sq Ft Home
- 2-Story Property
- Vaulted Ceiling
- Ceiling Fan
- Double Pane Windows
- Vinyl Clad Windows
- Insulated Windows
- Living Room with Fireplace
- Tile Flooring
Kitchen
- Oven
- Free-Standing Range
- Dishwasher
- Disposal
Bedrooms and Bathrooms
- 2 Bedrooms
Schools
- Live Oak Elementary School
- Deerpark Middle School
- Mcneil High School
Utilities
- Central Heating and Cooling System
- High Speed Internet
Listing and Financial Details
- Security Deposit $1,625
- Tenant pays for all utilities, exterior maintenance, insurance
- The owner pays for HVAC maintenance, insurance, pest control, taxes
- 12 Month Lease Term
- $65 Application Fee
- Assessor Parcel Number 164398000F0025
Community Details
Overview
- No Home Owners Association
- 2 Units
- Los Indios Add Sec 01 Subdivision
Pet Policy
- Pet Deposit $250
- Dogs and Cats Allowed
- Large pets allowed
Map
Source: Unlock MLS (Austin Board of REALTORS®)
MLS Number: 6194549
APN: R090394
Disclaimer: Certain information contained herein is derived from information provided by parties other than Homes.com. All information provided is deemed reliable, but is not guaranteed to be accurate and should be independently verified.
![]() Based on information from the Austin Board of REALTORS® (alternatively, from ACTRIS). Neither the Board nor ACTRIS guarantees or is in any way responsible for its accuracy. All data is provided “AS IS” and with all faults. Data maintained by the Board or ACTRIS may not reflect all real estate activity in the market.
Based on information from the Austin Board of REALTORS® (alternatively, from ACTRIS). Neither the Board nor ACTRIS guarantees or is in any way responsible for its accuracy. All data is provided “AS IS” and with all faults. Data maintained by the Board or ACTRIS may not reflect all real estate activity in the market.
Information being provided is for consumers’ personal, non-commercial use and may not be used for any purpose other than to identify prospective properties consumers may be interested in purchasing.
The Digital Millennium Copyright Act of 1998, 17 U.S.C. § 512 (the “DMCA”) provides recourse for copyright owners who believe that material appearing on the Internet infringes their rights under U.S. copyright law. If you believe in good faith that any content or material made available in connection with our website or services infringes your copyright, you (or your agent) may send us a notice requesting that the content or material be removed, or access to it blocked.
Notices must be sent in writing by email to DMCAnotice@MLSGrid.com.
The DMCA requires that your notice of alleged copyright infringement include the following information:
(1) description of the copyrighted work that is the subject of claimed infringement;
(2) description of the alleged infringing content and information sufficient to permit us to locate the content;
(3) contact information for you, including your address, telephone number and email address;
(4) a statement by you that you have a good faith belief that the content in the manner complained of is not authorized by the copyright owner, or its agent, or by the operation of any law;
(5) a statement by you, signed under penalty of perjury, that the information in the notification is accurate and that you have the authority to enforce the copyrights that are claimed to be infringed; and
(6) a physical or electronic signature of the copyright owner or a person authorized to act on the copyright owner’s behalf. Failure to include all of the above information may result in the delay of the processing of your complaint.
- 12325 Los Indios Trail Unit 31
- 12325 Los Indios Trail Unit 27
- 12325 Los Indios Trail Unit 12
- 8111 Elkhorn Mountain Trail
- 12401 Los Indios Trail Unit 5
- 7708 San Felipe Blvd Unit 8
- 12423 Los Indios Trail
- 12601 Oro Valley Cove
- 12413 Summersweet Cove
- 12703 Oro Valley Trail
- 8518 Cahill Dr Unit 36
- 8111 Matchlock Cove
- 12615 Dove Valley Trail
- 12709 Possum Hollow Dr
- 8330 Fathom Cir Unit 102
- 12711 Possum Hollow Dr
- 12211 Dundee Dr
- 12805 Tantara Dr
- 11814 Barrington Way
- 8340 Fathom Cir Unit 703G
- 8000 Tuscarora Trail Unit B
- 12316 Cahone Trail Unit A
- 7920 San Felipe Blvd
- 12308 Los Indios Trail
- 7900 San Felipe Blvd
- 7905 San Felipe Blvd
- 7800 Chimayo Cove Unit B
- 12325 Los Indios Trail Unit 6
- 8101 San Felipe Blvd
- 12342 Hunters Chase Dr
- 7708 San Felipe Blvd Unit 14
- 7708 San Felipe Blvd Unit 17
- 12406 Deer Falls Dr Unit A/B
- 12413 Deer Falls Dr Unit B
- 8519 Cahill Dr
- 12503 Deer Falls Dr
- 8518 Cahill Dr
- 8518 Cahill Dr Unit 8
- 8518 Cahill Dr Unit 20
- 8518 Cahill Dr Unit 36