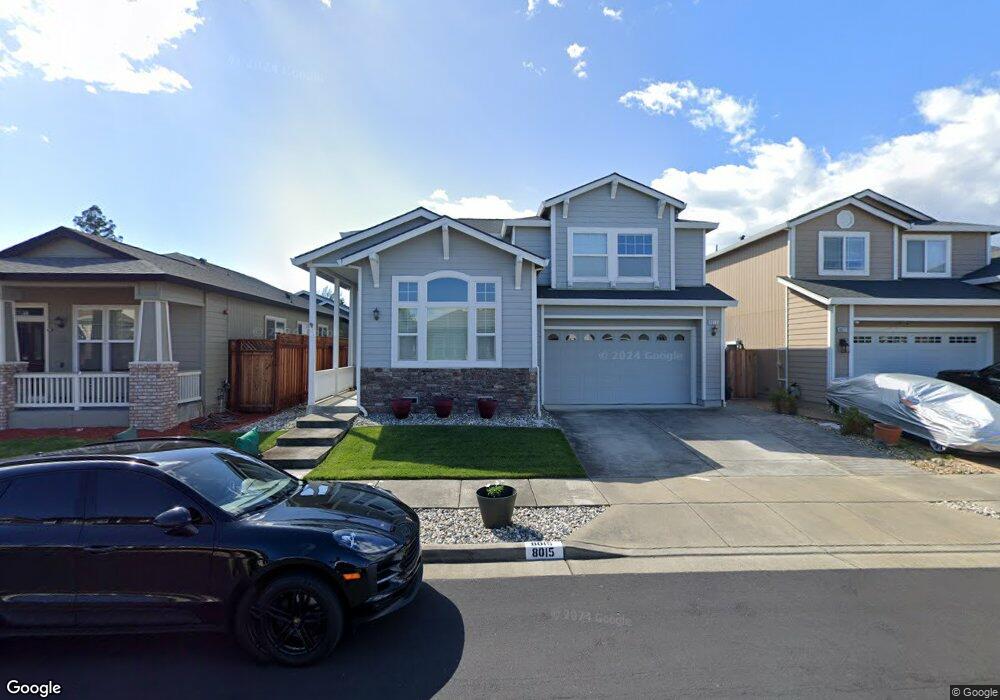
8015 Leno Dr Windsor, CA 95492
Estimated Value: $824,000 - $858,120
4
Beds
3
Baths
2,130
Sq Ft
$394/Sq Ft
Est. Value
About This Home
This home is located at 8015 Leno Dr, Windsor, CA 95492 and is currently estimated at $840,280, approximately $394 per square foot. 8015 Leno Dr is a home located in Sonoma County with nearby schools including Mattie Washburn Elementary School, Brooks Elementary School, and Windsor Middle School.
Ownership History
Date
Name
Owned For
Owner Type
Purchase Details
Closed on
Nov 20, 2014
Sold by
Clark Patricia A
Bought by
Zwetsloot Hans and Zwetsloot Jeaette
Current Estimated Value
Home Financials for this Owner
Home Financials are based on the most recent Mortgage that was taken out on this home.
Original Mortgage
$712,500
Outstanding Balance
$544,184
Interest Rate
3.92%
Mortgage Type
Reverse Mortgage Home Equity Conversion Mortgage
Estimated Equity
$296,096
Purchase Details
Closed on
May 4, 2006
Sold by
Vintage Greens Phase V Llc
Bought by
Clark Patricia A
Home Financials for this Owner
Home Financials are based on the most recent Mortgage that was taken out on this home.
Original Mortgage
$410,571
Interest Rate
6.29%
Mortgage Type
Fannie Mae Freddie Mac
Create a Home Valuation Report for This Property
The Home Valuation Report is an in-depth analysis detailing your home's value as well as a comparison with similar homes in the area
Home Values in the Area
Average Home Value in this Area
Purchase History
| Date | Buyer | Sale Price | Title Company |
|---|---|---|---|
| Zwetsloot Hans | $475,000 | Fidelity National Title Co | |
| Clark Patricia A | -- | North Bay Title Co |
Source: Public Records
Mortgage History
| Date | Status | Borrower | Loan Amount |
|---|---|---|---|
| Open | Zwetsloot Hans | $712,500 | |
| Previous Owner | Clark Patricia A | $410,571 |
Source: Public Records
Tax History
| Year | Tax Paid | Tax Assessment Tax Assessment Total Assessment is a certain percentage of the fair market value that is determined by local assessors to be the total taxable value of land and additions on the property. | Land | Improvement |
|---|---|---|---|---|
| 2025 | $6,779 | $570,869 | $228,347 | $342,522 |
| 2024 | $6,779 | $559,676 | $223,870 | $335,806 |
| 2023 | $6,779 | $548,703 | $219,481 | $329,222 |
| 2022 | $6,530 | $537,945 | $215,178 | $322,767 |
| 2021 | $6,425 | $527,398 | $210,959 | $316,439 |
| 2020 | $6,565 | $521,991 | $208,796 | $313,195 |
| 2019 | $6,528 | $511,756 | $204,702 | $307,054 |
| 2018 | $6,459 | $501,723 | $200,689 | $301,034 |
| 2017 | $6,398 | $491,886 | $196,754 | $295,132 |
| 2016 | $6,006 | $482,243 | $192,897 | $289,346 |
| 2015 | $5,840 | $475,000 | $190,000 | $285,000 |
| 2014 | $6,112 | $497,000 | $161,000 | $336,000 |
Source: Public Records
Map
Nearby Homes
- 1439 Birdie Dr
- 7830 Foppiano Way
- 1332 Eagle Dr
- 8484 Trione Cir
- 1384 Birdie Dr
- 8145 Willow St
- 1038 Capewood Ln
- 107 Bouquet Cir
- 8148 D St
- 8156 D St
- 1138 Broadleaf Ln
- 8147 Willow St
- 7225 16th Hole Dr
- 8596 Starr Rd
- 353 Patrick Ln
- 8843 Oakfield Ln
- 8169 Willow St
- 8182 Willow St
- 1349 Golf Course Dr
- 203 Cockrobin Ave
Your Personal Tour Guide
Ask me questions while you tour the home.