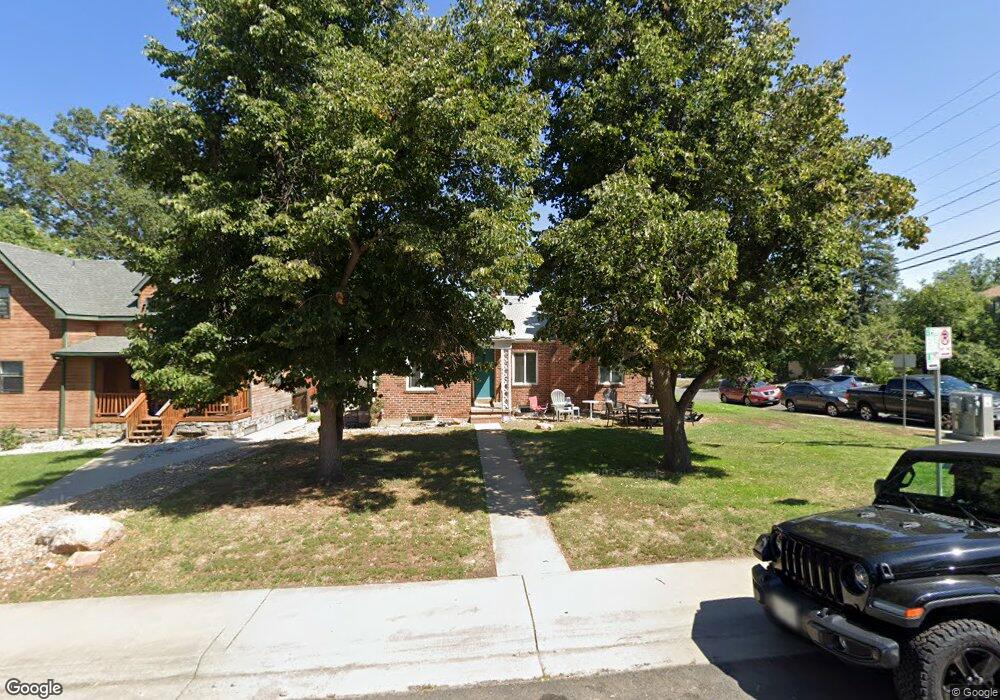
802 18th St Boulder, CO 80302
University Hill NeighborhoodEstimated Value: $1,285,000 - $1,398,000
4
Beds
2
Baths
1,380
Sq Ft
$986/Sq Ft
Est. Value
About This Home
This home is located at 802 18th St, Boulder, CO 80302 and is currently estimated at $1,360,245, approximately $985 per square foot. 802 18th St is a home located in Boulder County with nearby schools including Flatirons Elementary School, Manhattan Middle School of the Arts & Academics, and Boulder High School.
Ownership History
Date
Name
Owned For
Owner Type
Purchase Details
Closed on
Dec 17, 2004
Sold by
Lane Richard D and Lane Karen M
Bought by
Karen M Lane Declaration Of Trust
Current Estimated Value
Purchase Details
Closed on
Jun 9, 2003
Sold by
Lane Karen M and The Karen M Lane Declaration O
Bought by
Lane Richard D and Lane Karen M
Home Financials for this Owner
Home Financials are based on the most recent Mortgage that was taken out on this home.
Original Mortgage
$121,500
Outstanding Balance
$52,721
Interest Rate
5.65%
Mortgage Type
Purchase Money Mortgage
Estimated Equity
$1,307,524
Purchase Details
Closed on
Sep 2, 1992
Bought by
Lane Karen M Declaration Of Trust
Purchase Details
Closed on
Aug 28, 1992
Bought by
Lane Karen M Declaration Of Trust
Purchase Details
Closed on
Oct 2, 1991
Bought by
Lane Karen M Declaration Of Trust
Purchase Details
Closed on
Jul 31, 1991
Bought by
Lane Karen M Declaration Of Trust
Create a Home Valuation Report for This Property
The Home Valuation Report is an in-depth analysis detailing your home's value as well as a comparison with similar homes in the area
Home Values in the Area
Average Home Value in this Area
Purchase History
| Date | Buyer | Sale Price | Title Company |
|---|---|---|---|
| Karen M Lane Declaration Of Trust | -- | -- | |
| Lane Richard D | -- | Land Title Guarantee Company | |
| Lane Karen M Declaration Of Trust | $170,000 | -- | |
| Lane Karen M Declaration Of Trust | -- | -- | |
| Lane Karen M Declaration Of Trust | $150,500 | -- | |
| Lane Karen M Declaration Of Trust | -- | -- |
Source: Public Records
Mortgage History
| Date | Status | Borrower | Loan Amount |
|---|---|---|---|
| Open | Lane Richard D | $121,500 |
Source: Public Records
Tax History
| Year | Tax Paid | Tax Assessment Tax Assessment Total Assessment is a certain percentage of the fair market value that is determined by local assessors to be the total taxable value of land and additions on the property. | Land | Improvement |
|---|---|---|---|---|
| 2025 | $7,601 | $82,907 | $55,019 | $27,888 |
| 2024 | $7,601 | $82,907 | $55,019 | $27,888 |
| 2023 | $7,467 | $85,593 | $56,059 | $33,219 |
| 2022 | $6,720 | $71,551 | $45,926 | $25,625 |
| 2021 | $6,411 | $73,609 | $47,247 | $26,362 |
| 2020 | $6,003 | $68,969 | $39,325 | $29,644 |
| 2019 | $5,912 | $68,969 | $39,325 | $29,644 |
| 2018 | $5,393 | $62,208 | $35,208 | $27,000 |
| 2017 | $5,225 | $68,774 | $38,924 | $29,850 |
| 2016 | $4,863 | $56,182 | $32,318 | $23,864 |
| 2015 | $4,605 | $46,518 | $22,925 | $23,593 |
| 2014 | $3,911 | $46,518 | $22,925 | $23,593 |
Source: Public Records
Map
Nearby Homes
- 815 16th St
- 935 Broadway St Unit 104
- 850 20th St Unit 502
- 626 17th St
- 789 15th St
- 961 16th St Unit 5
- 851 14th St
- 715 14th St
- 2030 Columbine Ave
- 2141 Baseline Rd Unit 18
- 839 13th St
- 2221 Columbine Ave
- 650 12th St
- 1333 Mariposa Ave
- 1550 Bluebell Ave
- 350 15th St
- 370 20th St
- 1498 King Ave
- 333 Bellevue Dr
- 245 Fair Place
Your Personal Tour Guide
Ask me questions while you tour the home.