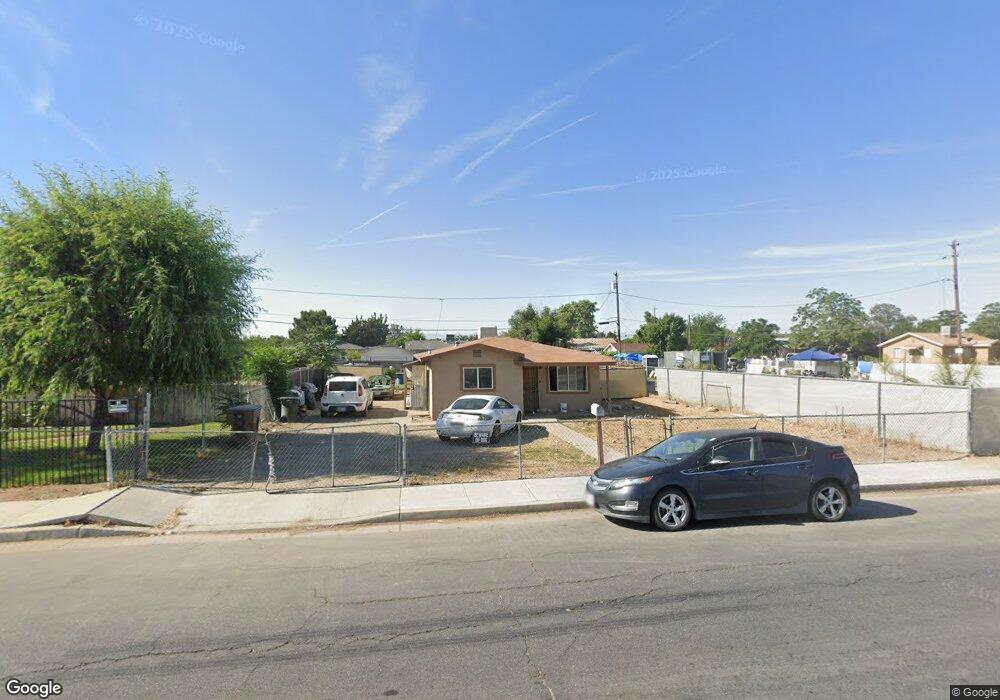
802 Watts Dr Bakersfield, CA 93307
Estimated Value: $189,000 - $256,000
3
Beds
1
Bath
1,060
Sq Ft
$209/Sq Ft
Est. Value
About This Home
This home is located at 802 Watts Dr, Bakersfield, CA 93307 and is currently estimated at $221,469, approximately $208 per square foot. 802 Watts Dr is a home located in Kern County with nearby schools including Casa Loma Elementary School, Sequoia Middle School, and Mira Monte High School.
Ownership History
Date
Name
Owned For
Owner Type
Purchase Details
Closed on
Oct 5, 2016
Sold by
Arambula Roman Deinino Jesus Becerra
Bought by
Bravo Maria
Current Estimated Value
Home Financials for this Owner
Home Financials are based on the most recent Mortgage that was taken out on this home.
Original Mortgage
$64,000
Interest Rate
3.42%
Mortgage Type
Seller Take Back
Purchase Details
Closed on
Sep 23, 2016
Sold by
Denney John D and Denney Marcela M
Bought by
Bravo Maria
Home Financials for this Owner
Home Financials are based on the most recent Mortgage that was taken out on this home.
Original Mortgage
$64,000
Interest Rate
3.42%
Mortgage Type
Seller Take Back
Purchase Details
Closed on
Mar 31, 2011
Sold by
Ulloa Pete and Ulloa Chila
Bought by
Denney John D and Denney Marcela M
Create a Home Valuation Report for This Property
The Home Valuation Report is an in-depth analysis detailing your home's value as well as a comparison with similar homes in the area
Home Values in the Area
Average Home Value in this Area
Purchase History
| Date | Buyer | Sale Price | Title Company |
|---|---|---|---|
| Bravo Maria | -- | Chicago Title Company | |
| Bravo Maria | $69,000 | Chicago Title Company | |
| Denney John D | $13,600 | None Available |
Source: Public Records
Mortgage History
| Date | Status | Borrower | Loan Amount |
|---|---|---|---|
| Previous Owner | Bravo Maria | $64,000 |
Source: Public Records
Tax History Compared to Growth
Tax History
| Year | Tax Paid | Tax Assessment Tax Assessment Total Assessment is a certain percentage of the fair market value that is determined by local assessors to be the total taxable value of land and additions on the property. | Land | Improvement |
|---|---|---|---|---|
| 2025 | $1,631 | $80,075 | $34,815 | $45,260 |
| 2024 | $1,631 | $78,506 | $34,133 | $44,373 |
| 2023 | $1,591 | $76,967 | $33,464 | $43,503 |
| 2022 | $1,542 | $75,458 | $32,808 | $42,650 |
| 2021 | $1,443 | $73,979 | $32,165 | $41,814 |
| 2020 | $1,408 | $73,222 | $31,836 | $41,386 |
| 2019 | $1,381 | $73,222 | $31,836 | $41,386 |
| 2018 | $1,352 | $70,380 | $30,600 | $39,780 |
| 2017 | $1,342 | $69,000 | $30,000 | $39,000 |
| 2016 | $665 | $15,147 | $10,821 | $4,326 |
| 2015 | $654 | $14,921 | $10,659 | $4,262 |
| 2014 | $635 | $14,630 | $10,451 | $4,179 |
Source: Public Records
Map
Nearby Homes