
Landlord's Agent in 2022
Agnes Bowman
Keller Williams Park Views Realty
(201) 456-0584
54 in this area
71 Total Sales


Estimated Value: $704,945 - $771,000
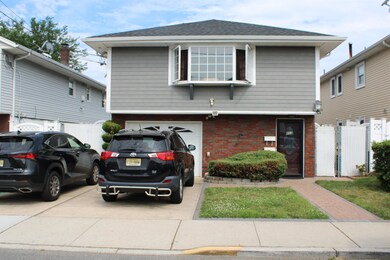
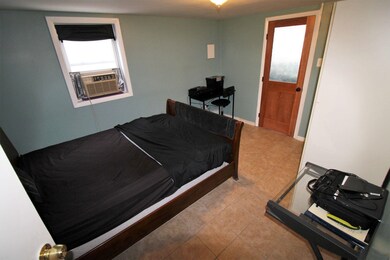
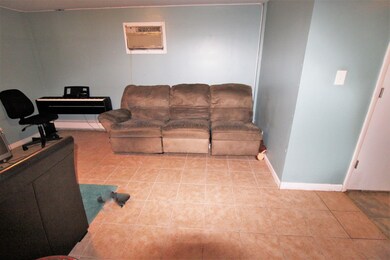
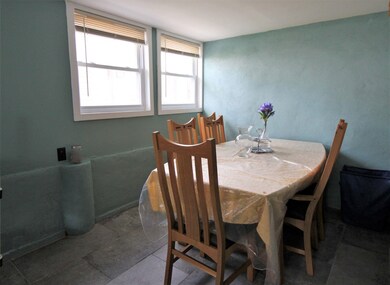
Spacious and well maintained first floor 1 bedroom apartment with extra Florida room. It is located in a quiet residential neighborhood. This 1br apt offers an eat-in kitchen, living rm, 1 full bath, 2 extra closets and 1 car parking spot. 1 block away from NYC Transportation, free shuttle to train station, shops and House of Worship. Move-in ready for September 1, 2022. Rent is $1500/mon., tenant pays all utilities including water. This apartment won't last!
Last Agent to Rent the Property
Keller Williams Park Views Realty License #9694308 Listed on: 07/05/2022
Last Renter's Agent
Keller Williams Park Views Realty License #9694308 Listed on: 07/05/2022
| Date | Buyer | Sale Price | Title Company |
|---|---|---|---|
| Desai Prakashbhai | $477,000 | Fidelity Natl Title Ins Co | |
| Nieter Mark F | $220,000 | Colonial Title & Abstract Sv |
| Date | Status | Borrower | Loan Amount |
|---|---|---|---|
| Previous Owner | Desai Prakashbhai | $325,000 | |
| Previous Owner | Nieter Mark F | $160,000 |
| Date | Event | Price | List to Sale | Price per Sq Ft |
|---|---|---|---|---|
| 08/01/2022 08/01/22 | Rented | $1,500 | -6.3% | -- |
| 07/12/2022 07/12/22 | Under Contract | -- | -- | -- |
| 07/05/2022 07/05/22 | For Rent | $1,600 | -- | -- |
| Year | Tax Paid | Tax Assessment Tax Assessment Total Assessment is a certain percentage of the fair market value that is determined by local assessors to be the total taxable value of land and additions on the property. | Land | Improvement |
|---|---|---|---|---|
| 2025 | $7,267 | $177,600 | $72,300 | $105,300 |
| 2024 | $7,049 | $177,600 | $72,300 | $105,300 |
| 2023 | $7,049 | $177,600 | $72,300 | $105,300 |
| 2022 | $6,548 | $174,000 | $72,300 | $101,700 |
| 2021 | $6,560 | $174,000 | $72,300 | $101,700 |
| 2020 | $6,501 | $174,000 | $72,300 | $101,700 |
| 2019 | $6,459 | $174,000 | $72,300 | $101,700 |
| 2018 | $6,281 | $174,000 | $72,300 | $101,700 |
| 2017 | $6,288 | $174,000 | $72,300 | $101,700 |
| 2016 | $6,450 | $174,000 | $72,300 | $101,700 |
| 2015 | $6,441 | $174,000 | $72,300 | $101,700 |
| 2014 | $6,553 | $174,000 | $72,300 | $101,700 |
Landlord's Agent in 2022
Agnes Bowman
Keller Williams Park Views Realty
(201) 456-0584
54 in this area
71 Total Sales
Source: Hudson County MLS
MLS Number: 220012114
APN: 09-00130-0000-00020
Disclaimer: Certain information contained herein is derived from information provided by parties other than Homes.com. All information provided is deemed reliable, but is not guaranteed to be accurate and should be independently verified.
![]() IDX information is provided exclusively for personal, non-commercial use, and may not be used for any purpose other than to identify prospective properties consumers may be interested in purchasing.
IDX information is provided exclusively for personal, non-commercial use, and may not be used for any purpose other than to identify prospective properties consumers may be interested in purchasing.
Information is deemed reliable but not guaranteed.