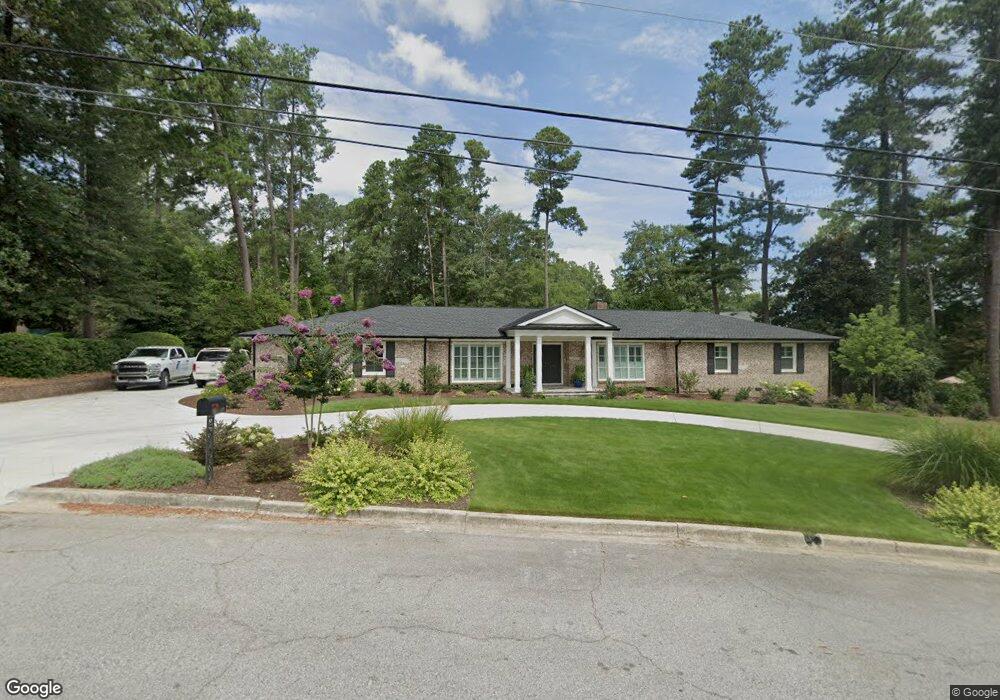
803 Carriage Ct Augusta, GA 30909
Lake Aumond NeighborhoodEstimated Value: $762,000 - $822,000
4
Beds
3
Baths
3,734
Sq Ft
$212/Sq Ft
Est. Value
About This Home
This home is located at 803 Carriage Ct, Augusta, GA 30909 and is currently estimated at $791,810, approximately $212 per square foot. 803 Carriage Ct is a home located in Richmond County with nearby schools including Lake Forest Hills Elementary School, Tutt Middle School, and Johnson Magnet.
Ownership History
Date
Name
Owned For
Owner Type
Purchase Details
Closed on
Feb 17, 2017
Sold by
Cagle Rachel Merry
Bought by
Showman Christopher and Showman Tracy G
Current Estimated Value
Home Financials for this Owner
Home Financials are based on the most recent Mortgage that was taken out on this home.
Original Mortgage
$318,750
Outstanding Balance
$262,454
Interest Rate
4.09%
Mortgage Type
New Conventional
Estimated Equity
$529,356
Purchase Details
Closed on
Apr 29, 2013
Sold by
Cagle William E
Bought by
Cagle William E and Cagle Rachel Merry
Home Financials for this Owner
Home Financials are based on the most recent Mortgage that was taken out on this home.
Original Mortgage
$302,175
Interest Rate
3.59%
Mortgage Type
New Conventional
Purchase Details
Closed on
Nov 17, 2010
Sold by
Dressel Robert J
Bought by
Dressel Robert J
Purchase Details
Closed on
May 6, 2008
Sold by
Dressel Robert J and Dressel Edna H
Bought by
Dressel Robert J
Create a Home Valuation Report for This Property
The Home Valuation Report is an in-depth analysis detailing your home's value as well as a comparison with similar homes in the area
Home Values in the Area
Average Home Value in this Area
Purchase History
| Date | Buyer | Sale Price | Title Company |
|---|---|---|---|
| Showman Christopher | $425,000 | -- | |
| Cagle William E | -- | -- | |
| Cagle William E | $335,750 | -- | |
| Dressel Robert J | -- | -- | |
| Dressel Robert J | -- | None Available |
Source: Public Records
Mortgage History
| Date | Status | Borrower | Loan Amount |
|---|---|---|---|
| Open | Showman Christopher | $318,750 | |
| Previous Owner | Cagle William E | $302,175 |
Source: Public Records
Tax History
| Year | Tax Paid | Tax Assessment Tax Assessment Total Assessment is a certain percentage of the fair market value that is determined by local assessors to be the total taxable value of land and additions on the property. | Land | Improvement |
|---|---|---|---|---|
| 2025 | $8,962 | $301,600 | $33,408 | $268,192 |
| 2024 | $8,962 | $285,520 | $33,408 | $252,112 |
| 2023 | $6,471 | $291,828 | $33,408 | $258,420 |
| 2022 | $5,646 | $179,485 | $33,408 | $146,077 |
| 2021 | $6,072 | $176,548 | $33,408 | $143,140 |
| 2020 | $5,573 | $164,322 | $33,408 | $130,914 |
| 2019 | $5,951 | $164,322 | $33,408 | $130,914 |
| 2018 | $5,994 | $164,059 | $33,408 | $130,651 |
| 2017 | $5,538 | $152,146 | $33,408 | $118,738 |
| 2016 | $5,541 | $152,146 | $33,408 | $118,738 |
| 2015 | $5,579 | $152,146 | $33,408 | $118,738 |
| 2014 | $5,124 | $151,827 | $33,408 | $118,419 |
Source: Public Records
Map
Nearby Homes
- 4016 Hidden Haven Ct
- 3071 Walton Way
- 3075 Walton Way
- 3134 Switzer Dr
- 600 Bransford Rd
- 3012 Langford Dr
- 3011 Fox Spring Rd
- 3160 Donald Rd
- 565 Martin Ln
- 750 Lancaster Rd
- 552 Whitehead Dr
- 568 Martin Ln
- 2875 Lake Forest Dr
- 3348 Walton Way
- 2833 Hazel St
- 2818 Hazel St
- 2816 Royal St
- 3134 Walton Way
- 542 Basin St
- 543 Basin St
- 3040 Walton Way Extension
- 805 Carriage Ct
- 801 Carriage Ct
- 3042 Walton Way Extension
- 806 Carriage Ct
- 808 Carriage Ct
- 3050 Walton Way Extension
- 802 Carriage Ct
- 804 Carriage Ct
- 3051 Walton Way Extension
- 3051 Walton Way
- 807 Carriage Ct
- 3053 Walton Way
- 3049 Walton Way Extension
- 3053 Walton Way Extension
- 810 Carriage Ct
- 801 Windsor Ct
- 3055 Walton Way
- 3054 Eton Ct
- 811 Carriage Ct