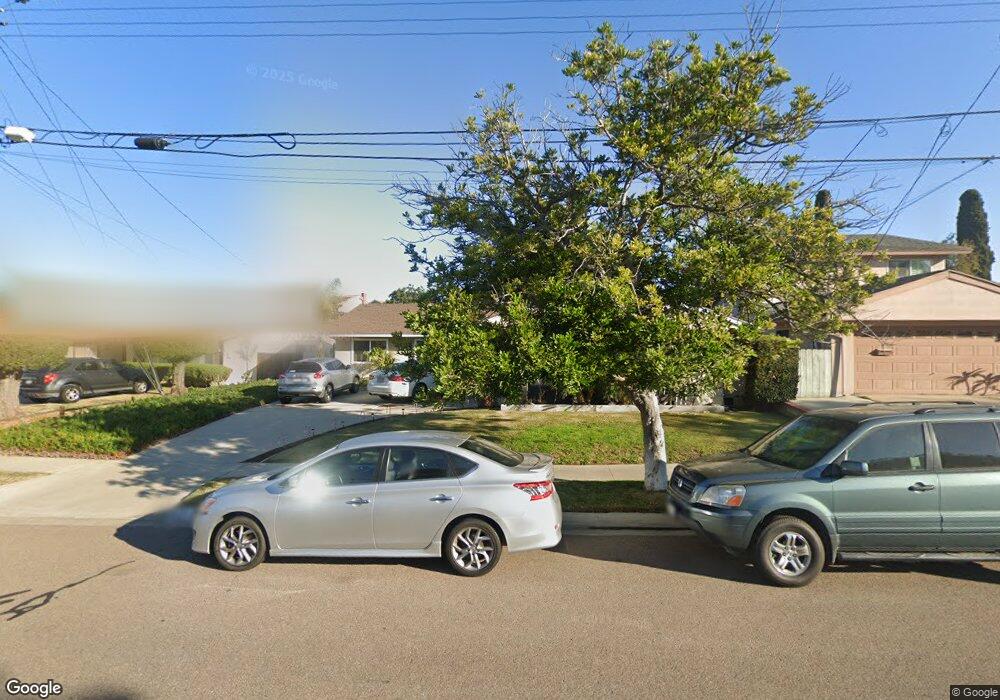
803 Lori Ln Chula Vista, CA 91910
Rancho Del Rey NeighborhoodEstimated Value: $868,709 - $937,000
5
Beds
3
Baths
1,691
Sq Ft
$535/Sq Ft
Est. Value
About This Home
This home is located at 803 Lori Ln, Chula Vista, CA 91910 and is currently estimated at $903,927, approximately $534 per square foot. 803 Lori Ln is a home located in San Diego County with nearby schools including Halecrest Elementary School, Hilltop Middle School, and Hilltop Senior High School.
Ownership History
Date
Name
Owned For
Owner Type
Purchase Details
Closed on
Nov 12, 2019
Sold by
Tamayo Patrick
Bought by
Tamayo Patricia and Chavez Leon Fernando
Current Estimated Value
Home Financials for this Owner
Home Financials are based on the most recent Mortgage that was taken out on this home.
Original Mortgage
$405,650
Outstanding Balance
$357,222
Interest Rate
3.65%
Mortgage Type
New Conventional
Estimated Equity
$546,705
Purchase Details
Closed on
Dec 12, 2012
Sold by
Morrison Michael L and Morrison Deborah A
Bought by
Tamayo Ricardo C and Tamayo Patricia
Home Financials for this Owner
Home Financials are based on the most recent Mortgage that was taken out on this home.
Original Mortgage
$197,500
Interest Rate
3.53%
Mortgage Type
New Conventional
Purchase Details
Closed on
Oct 18, 2012
Sold by
Benton Wayne and Benton Judy
Bought by
Morrison Michael and Morrison Deborah
Home Financials for this Owner
Home Financials are based on the most recent Mortgage that was taken out on this home.
Original Mortgage
$197,500
Interest Rate
3.53%
Mortgage Type
New Conventional
Purchase Details
Closed on
Nov 8, 2011
Sold by
Benton Wayne
Bought by
Benton Wayne and Benton Judy
Purchase Details
Closed on
Jun 8, 2011
Sold by
Benton Judy
Bought by
Benton Wayne
Purchase Details
Closed on
May 1, 2000
Sold by
Mwjt Benton Wayne J and Cordonier Judy L
Bought by
Benton Wayne Joseph and Benton Judy L
Home Financials for this Owner
Home Financials are based on the most recent Mortgage that was taken out on this home.
Original Mortgage
$145,990
Interest Rate
8.53%
Mortgage Type
FHA
Purchase Details
Closed on
Aug 29, 1996
Sold by
Benton Wayne J
Bought by
Benton Wayne Joseph and Cordonier Judy L
Home Financials for this Owner
Home Financials are based on the most recent Mortgage that was taken out on this home.
Original Mortgage
$141,667
Interest Rate
8.23%
Mortgage Type
FHA
Purchase Details
Closed on
Aug 28, 1996
Sold by
Benton Janice E and Benton Janice
Bought by
Benton Wayne
Home Financials for this Owner
Home Financials are based on the most recent Mortgage that was taken out on this home.
Original Mortgage
$141,667
Interest Rate
8.23%
Mortgage Type
FHA
Purchase Details
Closed on
Aug 20, 1996
Sold by
Cordonier Thomas L
Bought by
Cordonier Judy L
Home Financials for this Owner
Home Financials are based on the most recent Mortgage that was taken out on this home.
Original Mortgage
$141,667
Interest Rate
8.23%
Mortgage Type
FHA
Create a Home Valuation Report for This Property
The Home Valuation Report is an in-depth analysis detailing your home's value as well as a comparison with similar homes in the area
Home Values in the Area
Average Home Value in this Area
Purchase History
| Date | Buyer | Sale Price | Title Company |
|---|---|---|---|
| Tamayo Patricia | -- | Fidelity National Title Co | |
| Tamayo Patricia | -- | Fidelity National Title Co | |
| Tamayo Ricardo C | $396,000 | First American Title Company | |
| Morrison Michael | $262,500 | First American Title Company | |
| Benton Wayne | -- | None Available | |
| Benton Wayne | -- | None Available | |
| Benton Wayne Joseph | -- | Fidelity National Title Co | |
| Benton Wayne Joseph | -- | Guardian Title | |
| Benton Wayne | -- | Guardian Title Company | |
| Cordonier Judy L | -- | Guardian Title Company |
Source: Public Records
Mortgage History
| Date | Status | Borrower | Loan Amount |
|---|---|---|---|
| Open | Tamayo Patricia | $405,650 | |
| Previous Owner | Tamayo Ricardo C | $197,500 | |
| Previous Owner | Morrison Michael | $227,500 | |
| Previous Owner | Benton Wayne Joseph | $145,990 | |
| Previous Owner | Benton Wayne Joseph | $141,667 |
Source: Public Records
Tax History
| Year | Tax Paid | Tax Assessment Tax Assessment Total Assessment is a certain percentage of the fair market value that is determined by local assessors to be the total taxable value of land and additions on the property. | Land | Improvement |
|---|---|---|---|---|
| 2025 | $5,540 | $487,632 | $127,005 | $360,627 |
| 2024 | $5,540 | $478,071 | $124,515 | $353,556 |
| 2023 | $5,463 | $468,698 | $122,074 | $346,624 |
| 2022 | $5,305 | $459,509 | $119,681 | $339,828 |
| 2021 | $5,181 | $450,500 | $117,335 | $333,165 |
| 2020 | $5,056 | $445,881 | $116,132 | $329,749 |
| 2019 | $4,924 | $437,139 | $113,855 | $323,284 |
| 2018 | $4,847 | $428,569 | $111,623 | $316,946 |
| 2017 | $4,744 | $420,167 | $109,435 | $310,732 |
| 2016 | $4,632 | $411,930 | $107,290 | $304,640 |
| 2015 | $4,566 | $405,744 | $105,679 | $300,065 |
| 2014 | $4,488 | $397,797 | $103,609 | $294,188 |
Source: Public Records
Map
Nearby Homes
- 607 E J St
- 919 Caminito Estrella
- 417 Sanibelle Cir Unit 91
- 991 Calma Dr
- 1008 Calma Dr
- 453 Hidden Vista Dr
- 376 Roman Way
- 939 Nolan Way
- 302 Windjammer Cir
- 476 Montclair St
- 902 Monterey Ct
- 445 Montcalm St
- 350 Windjammer Cir
- 0 Julian Estates Rd Ct Unit NP26049137
- 586 88 Roosevelt St
- 835 Cedarbend Way
- 953 Maria Way
- 202 E J St
- 1139 Ocelot Ave
- 871 Blackwood Rd
Your Personal Tour Guide
Ask me questions while you tour the home.