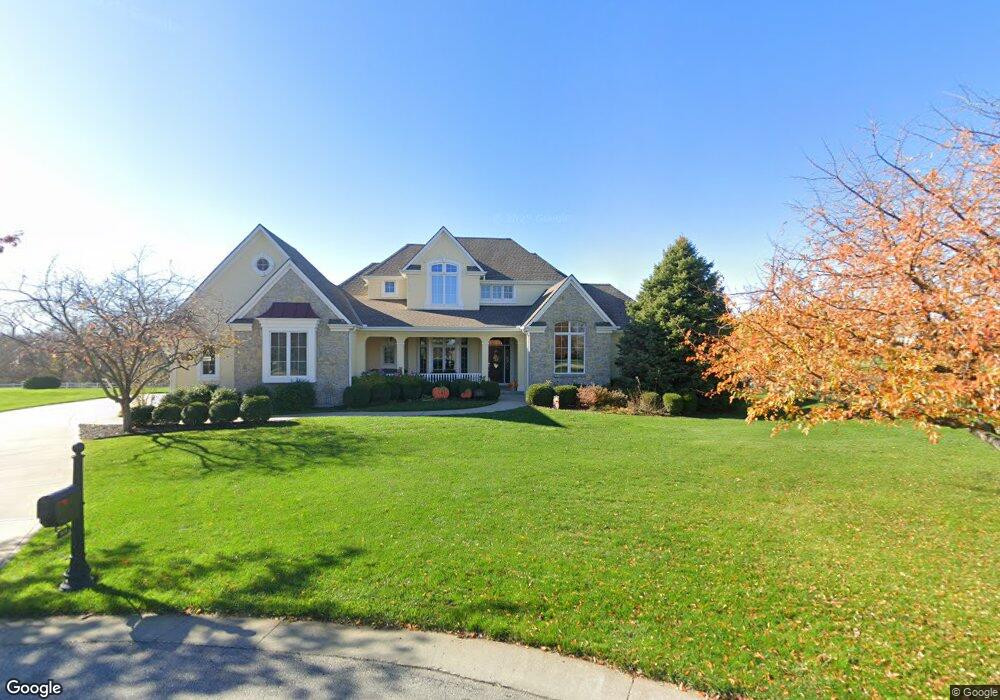
8030 NW Emerald Ct Kansas City, MO 64152
Estimated Value: $796,321 - $966,000
4
Beds
3
Baths
3,134
Sq Ft
$275/Sq Ft
Est. Value
About This Home
This home is located at 8030 NW Emerald Ct, Kansas City, MO 64152 and is currently estimated at $863,330, approximately $275 per square foot. 8030 NW Emerald Ct is a home located in Platte County with nearby schools including Hawthorn Elementary School, Congress Middle School, and Plaza Middle School.
Ownership History
Date
Name
Owned For
Owner Type
Purchase Details
Closed on
Aug 1, 2014
Sold by
Vore Keith R and Vore Judith A
Bought by
Vore Family Wealth Trust
Current Estimated Value
Purchase Details
Closed on
Sep 27, 2006
Sold by
Shawn Land Builders Inc
Bought by
Vore Keith R
Home Financials for this Owner
Home Financials are based on the most recent Mortgage that was taken out on this home.
Original Mortgage
$417,000
Outstanding Balance
$249,519
Interest Rate
6.51%
Mortgage Type
New Conventional
Estimated Equity
$613,811
Purchase Details
Closed on
Jan 24, 2006
Sold by
West Platte Devgelopments Llc
Bought by
Shawn Land Builders Inc
Home Financials for this Owner
Home Financials are based on the most recent Mortgage that was taken out on this home.
Original Mortgage
$469,000
Interest Rate
6.18%
Mortgage Type
Construction
Create a Home Valuation Report for This Property
The Home Valuation Report is an in-depth analysis detailing your home's value as well as a comparison with similar homes in the area
Home Values in the Area
Average Home Value in this Area
Purchase History
| Date | Buyer | Sale Price | Title Company |
|---|---|---|---|
| Vore Family Wealth Trust | -- | None Available | |
| Vore Keith R | -- | None Available | |
| Shawn Land Builders Inc | -- | Source One Title |
Source: Public Records
Mortgage History
| Date | Status | Borrower | Loan Amount |
|---|---|---|---|
| Open | Vore Keith R | $417,000 | |
| Previous Owner | Shawn Land Builders Inc | $469,000 |
Source: Public Records
Tax History Compared to Growth
Tax History
| Year | Tax Paid | Tax Assessment Tax Assessment Total Assessment is a certain percentage of the fair market value that is determined by local assessors to be the total taxable value of land and additions on the property. | Land | Improvement |
|---|---|---|---|---|
| 2024 | $8,637 | $114,700 | $9,481 | $105,219 |
| 2023 | $8,637 | $114,700 | $9,481 | $105,219 |
| 2022 | $7,993 | $104,845 | $9,481 | $95,364 |
| 2021 | $8,022 | $104,845 | $9,481 | $95,364 |
| 2020 | $8,180 | $104,845 | $9,481 | $95,364 |
| 2019 | $8,180 | $104,845 | $9,481 | $95,364 |
| 2018 | $8,290 | $104,845 | $9,481 | $95,364 |
| 2017 | $8,254 | $104,845 | $9,481 | $95,364 |
| 2016 | $8,386 | $104,845 | $9,481 | $95,364 |
| 2015 | $8,424 | $104,845 | $9,481 | $95,364 |
| 2013 | $8,189 | $104,845 | $0 | $0 |
Source: Public Records
Map
Nearby Homes
- 7702 NW Fawn Ave
- 0 Lot 42 N A Unit HMS2483939
- 0 Lot 43 N A Unit HMS2483936
- 0 Lot 37 N A Unit HMS2483903
- 0 Lot 56 N A Unit HMS2483889
- 0 Lot 45 N A Unit HMS2483927
- 0 Lot 46 N A Unit HMS2483924
- 0 Lot 41 N A Unit HMS2483941
- 0 Lot 4 N A Unit HMS2483555
- 0 Lot 51 N A Unit HMS2483880
- 0 Lot 55 N A Unit HMS2483745
- 0 Lot 5 N A Unit HMS2483885
- 0 Lot 11 N A
- 0 Lot 40 N A Unit HMS2483953
- 0 Lot 25 N A Unit HMS2483943
- 0 Lot 57 N A
- 0 Lot 35 N A Unit HMS2483908
- 7515 NW Fawn Cir
- 7445 NW Fawn Ave
- 7607 NW Roberts Rd
- 8040 NW Emerald Ct
- 8020 NW Emerald Ct
- 8035 NW Emerald Ct
- 8050 NW Emerald Ct
- 8055 NW Emerald Ct
- 8060 NW Emerald Ct
- 8065 NW Emerald Ct
- 7970 N Childress Ave
- 8070 NW Emerald Ct
- 11955 NW 81st St
- 8095 NW Elizabeth Ann Ct
- 8085 NW Elizabeth Ann Ct
- 11905 NW 81st St
- 8070 Green Glades Ct
- 11865 NW 81st St
- 8080 Green Glades Ct
- Lot 22 NW Elizabeth Ann Ct
- 12000 NW 81st St
- 12030 NW 81st St
- 11835 NW 81st St