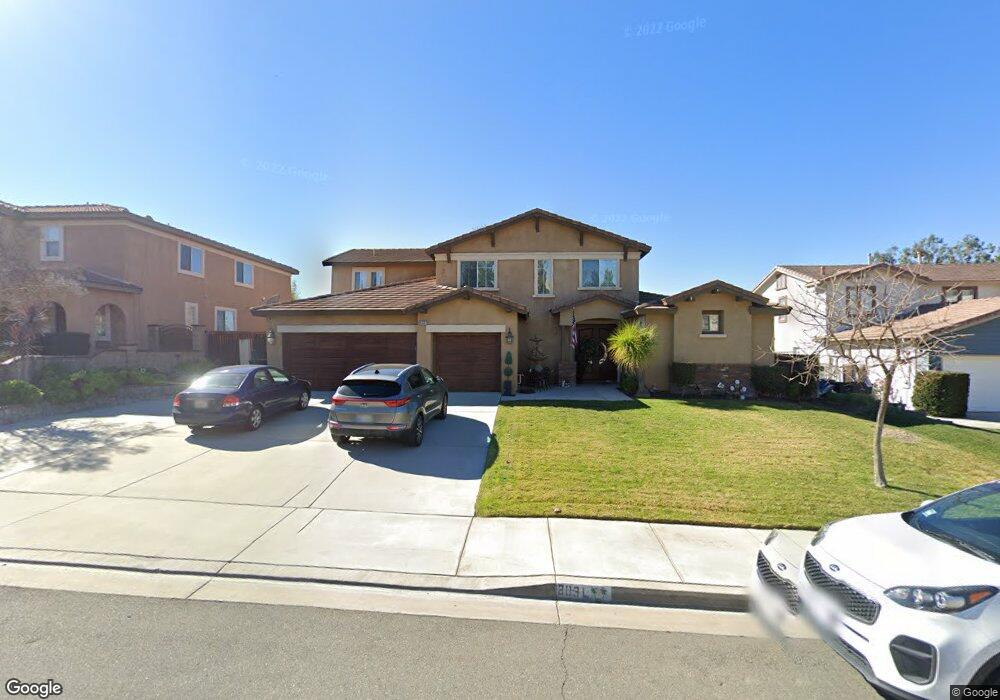
8031 Palm View Ln Riverside, CA 92508
Mission Grove NeighborhoodEstimated Value: $841,157 - $903,000
4
Beds
4
Baths
3,268
Sq Ft
$266/Sq Ft
Est. Value
About This Home
This home is located at 8031 Palm View Ln, Riverside, CA 92508 and is currently estimated at $869,789, approximately $266 per square foot. 8031 Palm View Ln is a home located in Riverside County with nearby schools including John F. Kennedy Elementary School, Amelia Earhart Middle School, and Martin Luther King Junior High School.
Ownership History
Date
Name
Owned For
Owner Type
Purchase Details
Closed on
Jan 6, 2020
Sold by
Echols Traneka P and Echols Alice D
Bought by
Echols Alice D and Echols Traneka P
Current Estimated Value
Home Financials for this Owner
Home Financials are based on the most recent Mortgage that was taken out on this home.
Original Mortgage
$591,700
Outstanding Balance
$568,396
Interest Rate
6.12%
Mortgage Type
New Conventional
Estimated Equity
$301,393
Purchase Details
Closed on
Jun 30, 2015
Sold by
Echols Traneka P
Bought by
Echols Traneka P and Echols Alice D
Purchase Details
Closed on
Jun 26, 2002
Sold by
Centex Homes
Bought by
Echols Traneka P
Home Financials for this Owner
Home Financials are based on the most recent Mortgage that was taken out on this home.
Original Mortgage
$266,082
Interest Rate
5.37%
Create a Home Valuation Report for This Property
The Home Valuation Report is an in-depth analysis detailing your home's value as well as a comparison with similar homes in the area
Home Values in the Area
Average Home Value in this Area
Purchase History
| Date | Buyer | Sale Price | Title Company |
|---|---|---|---|
| Echols Alice D | -- | Ticor Ttl Orange Cnty Branch | |
| Echols Traneka P | -- | None Available | |
| Echols Traneka P | $280,500 | Commerce Title |
Source: Public Records
Mortgage History
| Date | Status | Borrower | Loan Amount |
|---|---|---|---|
| Open | Echols Alice D | $591,700 | |
| Closed | Echols Traneka P | $266,082 |
Source: Public Records
Tax History
| Year | Tax Paid | Tax Assessment Tax Assessment Total Assessment is a certain percentage of the fair market value that is determined by local assessors to be the total taxable value of land and additions on the property. | Land | Improvement |
|---|---|---|---|---|
| 2025 | $5,961 | $457,082 | $96,007 | $361,075 |
| 2023 | $5,961 | $439,335 | $92,280 | $347,055 |
| 2022 | $5,869 | $430,721 | $90,471 | $340,250 |
| 2021 | $5,805 | $422,277 | $88,698 | $333,579 |
| 2020 | $5,769 | $417,948 | $87,789 | $330,159 |
| 2019 | $5,670 | $409,754 | $86,068 | $323,686 |
| 2018 | $5,579 | $401,721 | $84,382 | $317,339 |
| 2017 | $5,508 | $393,845 | $82,728 | $311,117 |
| 2016 | $5,219 | $386,123 | $81,106 | $305,017 |
| 2015 | $5,160 | $380,326 | $79,889 | $300,437 |
| 2014 | $5,135 | $372,877 | $78,325 | $294,552 |
Source: Public Records
Map
Nearby Homes
- 8004 Palm View Ln
- 14787 Wood Rd
- 19156 Zamora Way
- 19391 De Marco Rd
- 8170 Bon View Dr
- 1062 Rancho Valencia Dr
- 7639 Hillhurst Dr
- 19452 Fortunello Ave
- 19435 Fortunello Ave
- 1195 Pamplona Dr
- 4170 Sydney Harbour Dr
- 18590 Roberts Rd
- 14420 Merlot Ct
- 8449 Monique Ct
- 19689 Allenhurst St
- 8470 Lindenhurst St
- 7320 Barnstable Place
- 200 E Alessandro Blvd Unit 79
- 200 E Alessandro Blvd Unit 34
- 200 E Alessandro Blvd Unit 94
- 8041 Palm View Ln
- 8021 Palm View Ln
- 8036 Branding Iron Ln
- 8046 Branding Iron Ln
- 8051 Palm View Ln
- 8034 Palm View Ln
- 8024 Palm View Ln
- 8044 Palm View Ln
- 8056 Branding Iron Ln
- 19189 Turrell Way
- 19196 Kangnam Rd
- 19177 Turrell Way
- 8014 Palm View Ln
- 8061 Palm View Ln
- 8054 Palm View Ln
- 19165 Turrell Way
- 8064 Branding Iron Ln
- 8047 Branding Iron Ln
- 8064 Palm View Ln
- 19188 Kangnam Rd
Your Personal Tour Guide
Ask me questions while you tour the home.