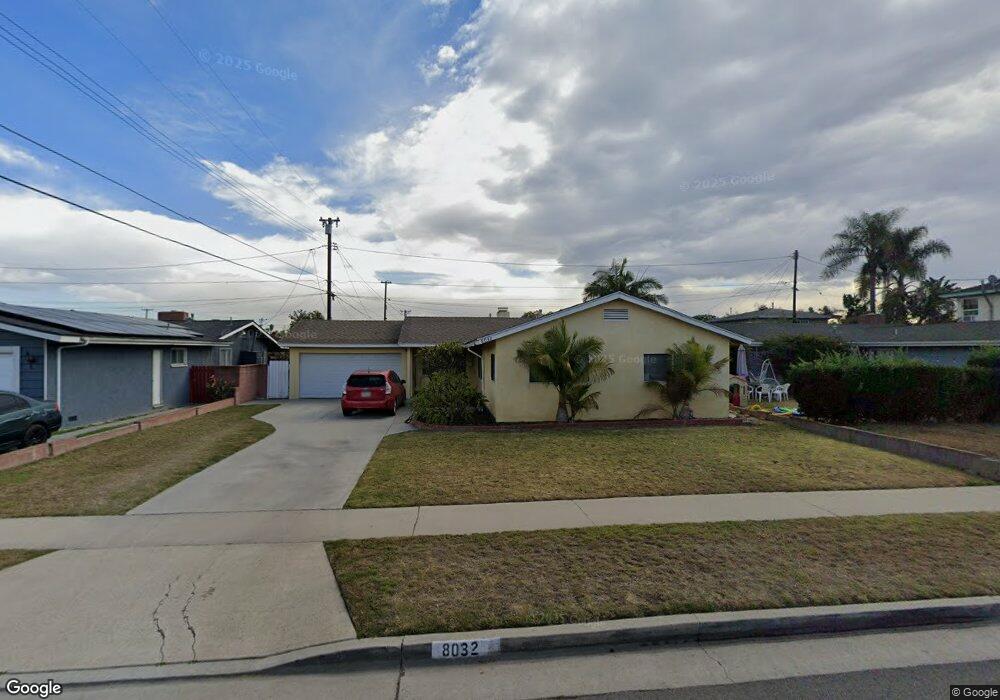
8032 San Lucas Cir Buena Park, CA 90620
Estimated Value: $875,894 - $932,000
4
Beds
2
Baths
1,343
Sq Ft
$671/Sq Ft
Est. Value
About This Home
This home is located at 8032 San Lucas Cir, Buena Park, CA 90620 and is currently estimated at $900,724, approximately $670 per square foot. 8032 San Lucas Cir is a home located in Orange County with nearby schools including Buena Terra Elementary School, Walker Junior High School, and John F. Kennedy High School.
Ownership History
Date
Name
Owned For
Owner Type
Purchase Details
Closed on
Mar 10, 2017
Sold by
Tran Andrew H and Wang Chih Chun
Bought by
Tran Andrew Hien and Wang Cherle Chih Chun
Current Estimated Value
Purchase Details
Closed on
Jun 28, 2011
Sold by
Sorensen Cristina Anne
Bought by
Tran Andrew H and Wang Chih Chun
Home Financials for this Owner
Home Financials are based on the most recent Mortgage that was taken out on this home.
Original Mortgage
$312,000
Outstanding Balance
$214,038
Interest Rate
4.45%
Mortgage Type
New Conventional
Estimated Equity
$686,686
Purchase Details
Closed on
May 17, 1996
Sold by
Sorensen Don B and Sorensen Grace A
Bought by
Sorensen Cristina Anne
Home Financials for this Owner
Home Financials are based on the most recent Mortgage that was taken out on this home.
Original Mortgage
$151,000
Interest Rate
7.97%
Create a Home Valuation Report for This Property
The Home Valuation Report is an in-depth analysis detailing your home's value as well as a comparison with similar homes in the area
Home Values in the Area
Average Home Value in this Area
Purchase History
| Date | Buyer | Sale Price | Title Company |
|---|---|---|---|
| Tran Andrew Hien | -- | None Available | |
| Tran Andrew H | $390,000 | Investors Title | |
| Sorensen Cristina Anne | $168,000 | First American Title Ins Co |
Source: Public Records
Mortgage History
| Date | Status | Borrower | Loan Amount |
|---|---|---|---|
| Open | Tran Andrew H | $312,000 | |
| Previous Owner | Sorensen Cristina Anne | $151,000 |
Source: Public Records
Tax History Compared to Growth
Tax History
| Year | Tax Paid | Tax Assessment Tax Assessment Total Assessment is a certain percentage of the fair market value that is determined by local assessors to be the total taxable value of land and additions on the property. | Land | Improvement |
|---|---|---|---|---|
| 2025 | $5,630 | $489,858 | $419,949 | $69,909 |
| 2024 | $5,630 | $480,253 | $411,714 | $68,539 |
| 2023 | $5,490 | $470,837 | $403,641 | $67,196 |
| 2022 | $5,420 | $461,605 | $395,726 | $65,879 |
| 2021 | $5,342 | $452,554 | $387,966 | $64,588 |
| 2020 | $5,311 | $447,914 | $383,988 | $63,926 |
| 2019 | $5,177 | $439,132 | $376,459 | $62,673 |
| 2018 | $5,082 | $430,522 | $369,077 | $61,445 |
| 2017 | $4,921 | $422,081 | $361,840 | $60,241 |
| 2016 | $4,827 | $413,805 | $354,745 | $59,060 |
| 2015 | $4,773 | $407,590 | $349,417 | $58,173 |
| 2014 | $4,532 | $399,606 | $342,572 | $57,034 |
Source: Public Records
Map
Nearby Homes
- 6191 San Ramon Way
- 5837 Los Arcos Way
- 8456 San Clemente Way
- 7571 San Rafael Dr
- 7837 La Costa Cir
- 8623 Valley View St
- 5686 Panama Dr
- 5836 Trinidad Way
- 5921 Los Ramos Cir
- 6601 Naomi Ave
- 8072 San Hilario Cir
- 5612 Sprague Ave
- 8757 Los Altos Dr
- 5342 La Luna Dr
- 6932 San Joaquin Cir
- 5568 Ozawa Cir
- 6961 San Julian Cir
- 6932 San Diego Dr
- 6613 San Haroldo Way
- 6507 San Alano Cir
- 8022 San Lucas Cir
- 8042 San Lucas Cir
- 8031 San Leon Cir
- 8041 San Leon Cir
- 8021 San Leon Cir
- 8052 San Lucas Cir
- 8012 San Lucas Cir
- 8031 San Lucas Cir
- 8011 San Leon Cir
- 8051 San Leon Cir
- 8041 San Lucas Cir
- 8021 San Lucas Cir
- 8051 San Lucas Cir
- 8011 San Lucas Cir
- 8002 San Lucas Cir
- 8001 San Leon Cir
- 8032 San Leon Cir
- 8032 San Luis Cir
- 8001 San Lucas Cir
- 8042 San Leon Cir