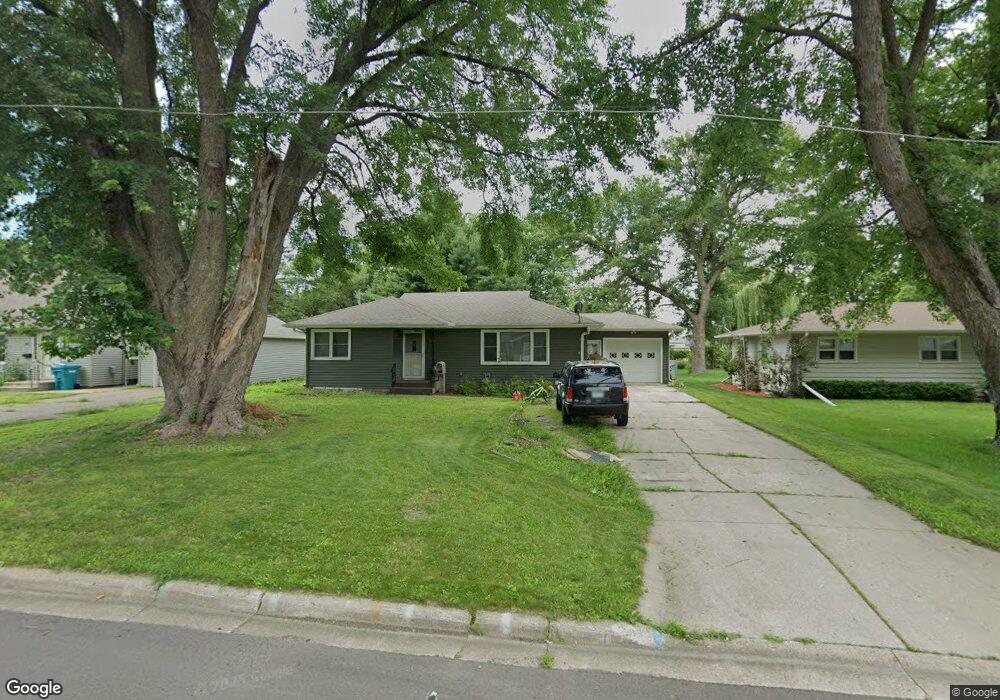
804 5th St SW Waseca, MN 56093
Estimated Value: $187,000 - $220,309
2
Beds
2
Baths
1,722
Sq Ft
$117/Sq Ft
Est. Value
About This Home
This home is located at 804 5th St SW, Waseca, MN 56093 and is currently estimated at $201,827, approximately $117 per square foot. 804 5th St SW is a home located in Waseca County with nearby schools including Hartley Elementary School, Waseca Intermediate School, and Waseca Junior High School.
Ownership History
Date
Name
Owned For
Owner Type
Purchase Details
Closed on
Oct 21, 2022
Sold by
Murphy Troy
Bought by
Warmsbecker Rhett
Current Estimated Value
Home Financials for this Owner
Home Financials are based on the most recent Mortgage that was taken out on this home.
Original Mortgage
$205,000
Outstanding Balance
$197,063
Interest Rate
5.89%
Mortgage Type
New Conventional
Estimated Equity
$4,764
Purchase Details
Closed on
Feb 22, 2021
Sold by
Ellis Devon and Ellis Madison
Bought by
Murphy Troy
Purchase Details
Closed on
Mar 3, 2017
Sold by
Bramer Jeremiah Jeremiah
Bought by
Krienke Madison Madison and Ellis Devon Devon
Home Financials for this Owner
Home Financials are based on the most recent Mortgage that was taken out on this home.
Original Mortgage
$122,489
Interest Rate
4.09%
Create a Home Valuation Report for This Property
The Home Valuation Report is an in-depth analysis detailing your home's value as well as a comparison with similar homes in the area
Home Values in the Area
Average Home Value in this Area
Purchase History
| Date | Buyer | Sale Price | Title Company |
|---|---|---|---|
| Warmsbecker Rhett | $205,000 | -- | |
| Murphy Troy | $158,000 | None Available | |
| Krienke Madison Madison | $124,800 | -- | |
| Krienke Madison | $124,750 | None Available | |
| Murphy Troy Troy | $158,000 | -- |
Source: Public Records
Mortgage History
| Date | Status | Borrower | Loan Amount |
|---|---|---|---|
| Open | Warmsbecker Rhett | $205,000 | |
| Previous Owner | Krienke Madison Madison | $122,489 | |
| Closed | Murphy Troy Troy | $2,862 |
Source: Public Records
Tax History Compared to Growth
Tax History
| Year | Tax Paid | Tax Assessment Tax Assessment Total Assessment is a certain percentage of the fair market value that is determined by local assessors to be the total taxable value of land and additions on the property. | Land | Improvement |
|---|---|---|---|---|
| 2024 | $2,346 | $175,000 | $34,300 | $140,700 |
| 2023 | $2,656 | $187,900 | $34,300 | $153,600 |
| 2022 | $2,316 | $155,800 | $41,800 | $114,000 |
| 2021 | $2,108 | $135,300 | $36,400 | $98,900 |
| 2020 | $2,000 | $125,200 | $33,800 | $91,400 |
| 2019 | $1,750 | $119,100 | $32,300 | $86,800 |
| 2018 | $1,708 | $107,500 | $29,000 | $78,500 |
| 2017 | $1,564 | $79,900 | $21,554 | $58,346 |
| 2016 | $1,396 | $78,300 | $20,314 | $57,986 |
| 2015 | -- | $68,400 | $18,988 | $49,412 |
Source: Public Records
Map
Nearby Homes
- 521 6th St SW
- 616 State St S
- 208 9th Ave SE
- 209 10th Ave SE
- 117 2nd St NE Unit 120 2nd Ave NE
- 312 2nd Ave SE
- 504 State St N
- 522 2nd Ave NE
- 414 3rd St NE
- 706 4th Ave SE
- 708 8th St SE
- 414 8th St SE
- 621 Elm Ave E
- 210 7th Ave NE
- 900 10th St SE
- 517 14th St NW
- 513 14th St NW
- 929 Elm Ave E
- 312 12th Ave NW
- 217 11th Avenue Ct NE
- 800 5th St SW
- 808 5th St SW
- 812 5th St SW
- 722 5th St SW
- 812 812 5th St SW
- 805 6th St SW
- 801 6th St SW
- 809 6th St SW
- 816 5th St SW
- 718 5th St SW
- 718 5th St SW Unit Fifth Street SW
- 813 6th St SW
- 721 6th St SW
- 809 5th St SW
- 819 6th St SW
- 801 5th St SW
- 820 5th St SW
- 717 6th St SW
- 813 813 Sw 5th
- 813 5th St SW