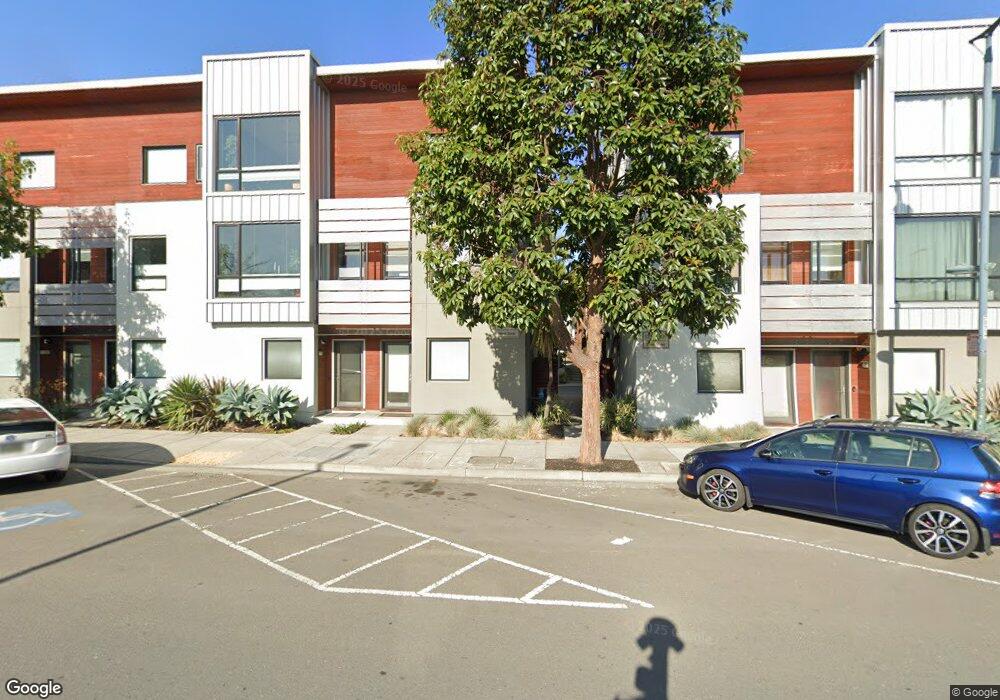
804 Zephyr Dr Unit 22 Oakland, CA 94607
West Oakland NeighborhoodEstimated Value: $530,000 - $577,000
2
Beds
3
Baths
987
Sq Ft
$563/Sq Ft
Est. Value
About This Home
This home is located at 804 Zephyr Dr Unit 22, Oakland, CA 94607 and is currently estimated at $555,394, approximately $562 per square foot. 804 Zephyr Dr Unit 22 is a home located in Alameda County with nearby schools including Prescott Elementary School, West Oakland Middle School, and McClymonds High School.
Ownership History
Date
Name
Owned For
Owner Type
Purchase Details
Closed on
Aug 25, 2015
Sold by
Miranda Roel and Miranda Eileen
Bought by
Soriano Juan M and Soriano Natalia M
Current Estimated Value
Purchase Details
Closed on
Jun 24, 2013
Sold by
Forrester Wale S and Forrester Kandace S
Bought by
Miranda Roel and Miranda Eileen
Home Financials for this Owner
Home Financials are based on the most recent Mortgage that was taken out on this home.
Original Mortgage
$315,400
Interest Rate
3.88%
Mortgage Type
New Conventional
Purchase Details
Closed on
Dec 28, 2007
Sold by
Pulte Home Corp
Bought by
Forrester Wale S and Forrester Kandace S
Home Financials for this Owner
Home Financials are based on the most recent Mortgage that was taken out on this home.
Original Mortgage
$294,400
Interest Rate
6.21%
Mortgage Type
Purchase Money Mortgage
Create a Home Valuation Report for This Property
The Home Valuation Report is an in-depth analysis detailing your home's value as well as a comparison with similar homes in the area
Home Values in the Area
Average Home Value in this Area
Purchase History
| Date | Buyer | Sale Price | Title Company |
|---|---|---|---|
| Soriano Juan M | $510,000 | Chicago Title Company | |
| Miranda Roel | $332,000 | Chicago Title Company | |
| Forrester Wale S | $368,000 | Chicago Title Company |
Source: Public Records
Mortgage History
| Date | Status | Borrower | Loan Amount |
|---|---|---|---|
| Previous Owner | Miranda Roel | $315,400 | |
| Previous Owner | Forrester Wale S | $294,400 |
Source: Public Records
Tax History Compared to Growth
Tax History
| Year | Tax Paid | Tax Assessment Tax Assessment Total Assessment is a certain percentage of the fair market value that is determined by local assessors to be the total taxable value of land and additions on the property. | Land | Improvement |
|---|---|---|---|---|
| 2025 | $9,348 | $596,721 | $181,116 | $422,605 |
| 2024 | $9,348 | $591,884 | $177,565 | $414,319 |
| 2023 | $9,789 | $580,282 | $174,084 | $406,198 |
| 2022 | $9,497 | $568,904 | $170,671 | $398,233 |
| 2021 | $9,076 | $557,750 | $167,325 | $390,425 |
| 2020 | $8,977 | $552,033 | $165,610 | $386,423 |
| 2019 | $8,637 | $541,211 | $162,363 | $378,848 |
| 2018 | $8,459 | $530,603 | $159,181 | $371,422 |
| 2017 | $7,653 | $520,200 | $156,060 | $364,140 |
| 2016 | $7,818 | $510,000 | $153,000 | $357,000 |
| 2015 | $5,447 | $338,633 | $101,590 | $237,043 |
| 2014 | $5,466 | $332,000 | $99,600 | $232,400 |
Source: Public Records
Map
Nearby Homes
- 1211 Wood St Unit 94
- 1759 14th St
- 1307 Pullman Way
- 1405 Wood St
- 1201 Pine St Unit 153
- 1201 Pine St Unit 130
- 1201 Pine St Unit 315
- 1201 Pine St Unit 365
- 1201 Pine St Unit 363
- 1234 Willow St
- 1807 16th St
- 1699 12th St
- 856 & 858 21st
- 945 Wood St
- 1211 Campbell St
- 1019 Campbell St
- 1626 12th St
- 875 Wood St
- 874 Pine St
- 1727 9th St
- 807 Zephyr Dr
- 801 Zephyr Dr Unit 19
- 806 Zephyr Dr
- 803 Zephyr Dr
- 802 Zephyr Dr Unit 20
- 901 Zephyr Dr
- 902 Zephyr Dr Unit 17
- 903 Zephyr Dr
- 904 Zephyr Dr Unit 15
- 905 Zephyr Dr
- 906 Zephyr Dr Unit 13
- 907 Zephyr Dr Unit 12
- 701 Zephyr Dr Unit 36
- 705 Zephyr Dr
- 707 Zephyr Dr Unit 30
- 708 Zephyr Dr Unit 29
- 711 Zephyr Dr Unit 27
- 709 Zephyr Dr
- 702 Zephyr Dr
- 703 Zephyr Dr Unit 34