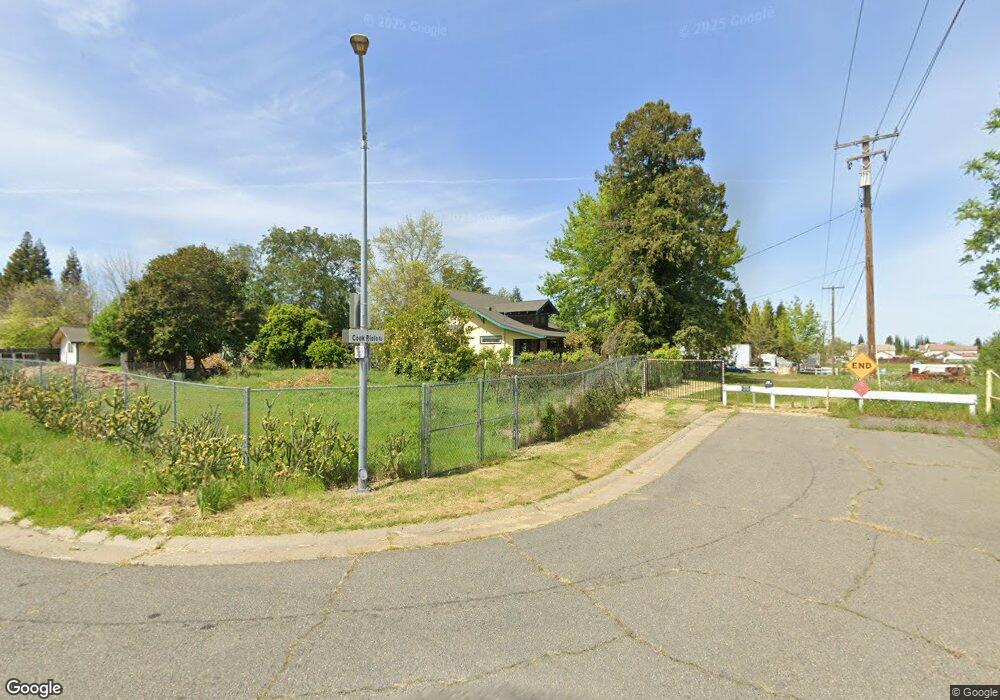
8045 Cook Riolo Rd Antelope, CA 95843
Estimated Value: $461,000 - $816,000
5
Beds
2
Baths
2,352
Sq Ft
$271/Sq Ft
Est. Value
About This Home
This home is located at 8045 Cook Riolo Rd, Antelope, CA 95843 and is currently estimated at $636,255, approximately $270 per square foot. 8045 Cook Riolo Rd is a home located in Sacramento County with nearby schools including Olive Grove Elementary School, Antelope Crossing Middle School, and Antelope High School.
Ownership History
Date
Name
Owned For
Owner Type
Purchase Details
Closed on
May 27, 2020
Sold by
Bean Peggy L and The Bean Family Trust
Bought by
Bean Peggy L and White Larry D
Current Estimated Value
Purchase Details
Closed on
Nov 21, 2011
Sold by
Bean Peggy L
Bought by
Bean Peggy L and The Bean Family Trust
Home Financials for this Owner
Home Financials are based on the most recent Mortgage that was taken out on this home.
Original Mortgage
$186,200
Outstanding Balance
$127,399
Interest Rate
4.09%
Mortgage Type
New Conventional
Estimated Equity
$508,856
Purchase Details
Closed on
Jun 23, 2010
Sold by
Bean Peggy
Bought by
Bean Peggy L
Purchase Details
Closed on
Oct 8, 2001
Sold by
Garnett Richard H and Garnett Patricia L
Bought by
Bean Peggy
Home Financials for this Owner
Home Financials are based on the most recent Mortgage that was taken out on this home.
Original Mortgage
$194,750
Interest Rate
6.91%
Create a Home Valuation Report for This Property
The Home Valuation Report is an in-depth analysis detailing your home's value as well as a comparison with similar homes in the area
Home Values in the Area
Average Home Value in this Area
Purchase History
| Date | Buyer | Sale Price | Title Company |
|---|---|---|---|
| Bean Peggy L | -- | None Available | |
| Bean Peggy L | -- | Accommodation | |
| Bean Peggy L | -- | Placer Title Company | |
| Bean Peggy L | -- | None Available | |
| Bean Peggy | $205,000 | Financial Title Company |
Source: Public Records
Mortgage History
| Date | Status | Borrower | Loan Amount |
|---|---|---|---|
| Open | Bean Peggy L | $186,200 | |
| Closed | Bean Peggy | $194,750 |
Source: Public Records
Tax History Compared to Growth
Tax History
| Year | Tax Paid | Tax Assessment Tax Assessment Total Assessment is a certain percentage of the fair market value that is determined by local assessors to be the total taxable value of land and additions on the property. | Land | Improvement |
|---|---|---|---|---|
| 2025 | $3,207 | $302,825 | $104,876 | $197,949 |
| 2024 | $3,207 | $296,888 | $102,820 | $194,068 |
| 2023 | $3,171 | $291,067 | $100,804 | $190,263 |
| 2022 | $3,175 | $285,361 | $98,828 | $186,533 |
| 2021 | $3,190 | $279,767 | $96,891 | $182,876 |
| 2020 | $3,166 | $276,899 | $95,898 | $181,001 |
| 2019 | $3,121 | $271,470 | $94,018 | $177,452 |
| 2018 | $3,009 | $266,148 | $92,175 | $173,973 |
| 2017 | $2,966 | $260,930 | $90,368 | $170,562 |
| 2016 | $2,889 | $255,815 | $88,597 | $167,218 |
| 2015 | $3,477 | $251,974 | $87,267 | $164,707 |
| 2014 | $3,412 | $247,039 | $85,558 | $161,481 |
Source: Public Records
Map
Nearby Homes
- 0 Lewis Ave
- 8268 Ghislaine Way
- 8008 Landmark Place
- 9025 Palmerson Dr
- 8344 Coven Hills Place
- 7665 Copper Cove Place
- 4923 Falconwood Ct
- 9670 Canopy Tree St
- 4924 Meadow Pass Way
- 3185 River Bank Ct
- 8038 Falcon View Dr
- 8011 Eagle Peak Way
- 7625 Downing Place Way
- 7631 Conklin Ct
- 7929 Eagle Peak Way
- 9620 Antelope Rd
- 7633 Wood Duck Ln Unit 67
- 5921 Cackler Ln
- 5922 Cackler Ln Unit 83
- 7408 Azimuth Ln Unit 242
- 5417 Whitehaven Way
- 5416 Cheviot Hill Ct
- 5412 Cheviot Hill Ct
- 5417 Cheviot Hill Ct
- 5413 Whitehaven Way
- 8111 Cook Riolo Rd
- 5408 Cheviot Hill Ct
- 5413 Cheviot Hill Ct
- 5409 Whitehaven Way
- 5409 Cheviot Hill Ct
- 5404 Cheviot Hill Ct
- 8012 Tyne Fell Ct
- 5405 Whitehaven Way
- 5412 Berwick Moor Place
- 8017 Tyne Fell Ct
- 5405 Cheviot Hill Ct
- 5416 Berwick Moor Place
- 5515 Pruitt Ln
- 5400 Cheviot Hill Ct
- 8013 Tyne Fell Ct