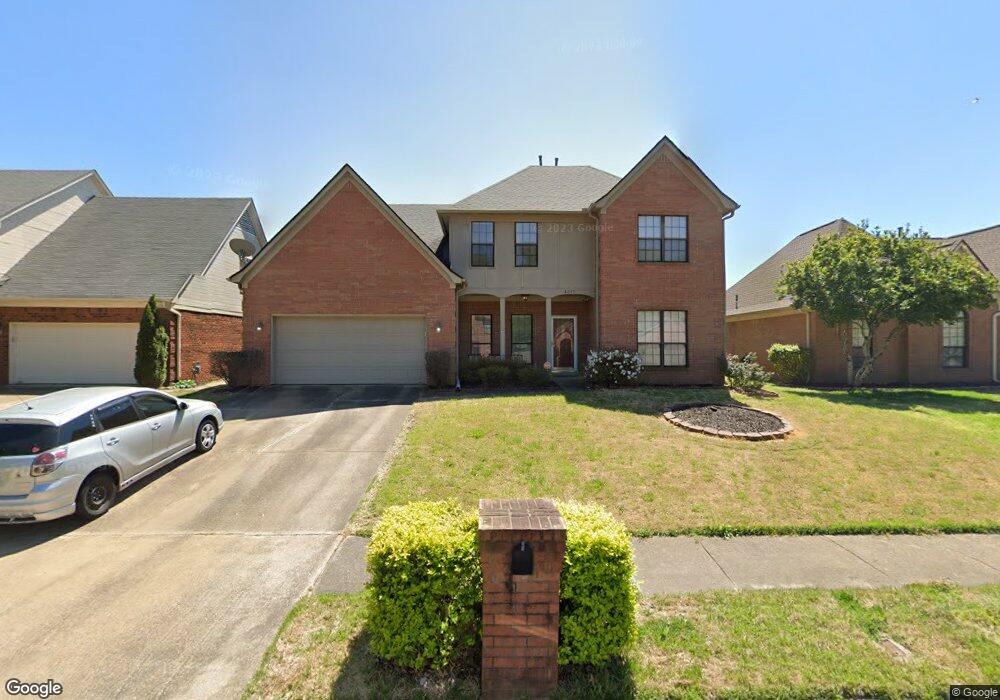
8045 Jills Creek Dr Memphis, TN 38133
Estimated Value: $333,099 - $403,000
4
Beds
3
Baths
2,409
Sq Ft
$155/Sq Ft
Est. Value
About This Home
This home is located at 8045 Jills Creek Dr, Memphis, TN 38133 and is currently estimated at $373,275, approximately $154 per square foot. 8045 Jills Creek Dr is a home located in Shelby County with nearby schools including Oak Elementary School, Appling Middle School, and Bartlett High School.
Ownership History
Date
Name
Owned For
Owner Type
Purchase Details
Closed on
Feb 28, 2011
Sold by
Marquardt Randy and Marquardt Christi A
Bought by
Prudential Relocation Inc
Current Estimated Value
Purchase Details
Closed on
Dec 7, 2010
Sold by
Prudential Relocation Inc
Bought by
Yatar Cinen M and Yatar Elma Lynne F
Home Financials for this Owner
Home Financials are based on the most recent Mortgage that was taken out on this home.
Original Mortgage
$180,310
Interest Rate
4.75%
Mortgage Type
FHA
Purchase Details
Closed on
Mar 29, 2000
Sold by
Binkley Homes Inc
Bought by
Marquardt Randy and Marquardt Christi A
Home Financials for this Owner
Home Financials are based on the most recent Mortgage that was taken out on this home.
Original Mortgage
$132,000
Interest Rate
8.38%
Purchase Details
Closed on
Jan 25, 2000
Sold by
Country Meadows Development Corporation
Bought by
Binkley Homes Inc
Create a Home Valuation Report for This Property
The Home Valuation Report is an in-depth analysis detailing your home's value as well as a comparison with similar homes in the area
Home Values in the Area
Average Home Value in this Area
Purchase History
| Date | Buyer | Sale Price | Title Company |
|---|---|---|---|
| Prudential Relocation Inc | $185,000 | Premium Title Group Llc | |
| Yatar Cinen M | $185,000 | Premium Title Group Llc | |
| Marquardt Randy | $173,775 | Memphis Title | |
| Binkley Homes Inc | $39,000 | -- |
Source: Public Records
Mortgage History
| Date | Status | Borrower | Loan Amount |
|---|---|---|---|
| Previous Owner | Yatar Cinen M | $180,310 | |
| Previous Owner | Marquardt Randy | $132,000 |
Source: Public Records
Tax History Compared to Growth
Tax History
| Year | Tax Paid | Tax Assessment Tax Assessment Total Assessment is a certain percentage of the fair market value that is determined by local assessors to be the total taxable value of land and additions on the property. | Land | Improvement |
|---|---|---|---|---|
| 2025 | $2,171 | $83,400 | $15,250 | $68,150 |
| 2024 | $2,171 | $64,050 | $10,250 | $53,800 |
| 2023 | $3,279 | $64,050 | $10,250 | $53,800 |
| 2022 | $3,279 | $64,050 | $10,250 | $53,800 |
| 2021 | $3,331 | $64,050 | $10,250 | $53,800 |
| 2020 | $2,834 | $48,200 | $9,500 | $38,700 |
| 2019 | $2,834 | $48,200 | $9,500 | $38,700 |
| 2018 | $2,834 | $48,200 | $9,500 | $38,700 |
| 2017 | $1,981 | $48,200 | $9,500 | $38,700 |
| 2016 | $1,897 | $43,400 | $0 | $0 |
| 2014 | $1,897 | $43,400 | $0 | $0 |
Source: Public Records
Map
Nearby Homes
- 3580 Sunrise Ln
- 0 N Germantown Pkwy
- 3466 N Germantown Pkwy
- 7922 Windersville Dr
- 7909 Country Lake Dr
- 7881 Country Lake Dr
- 3456 Post Elm Ln
- 8065 Sundown Ln
- 7827 Jills Creek Cove
- 7877 Hyman Dr
- 8086 Claredale Dr
- 7890 Stephanie Cove
- 3500 Bartlett Gap Cove
- 3384 N Germantown Rd
- 3830 Haynes Rd
- 8007 Steven Franklin Dr
- 3942 Kimberly Dawn Cove
- 8070 Memphis Arlington Rd
- 8224 Memphis Arlington Rd
- 3315 Richland Valley Dr
- 8041 Jills Creek Dr
- 8051 Jills Creek Dr
- 8035 Jills Creek Dr
- 8036 Windersville Dr
- 8044 Windersville Dr
- 8030 Windersville Dr
- 8057 Jills Creek Dr
- 8046 Jills Creek Dr
- 8042 Jills Creek Dr
- 8029 Jills Creek Dr
- 8052 Jills Creek Dr
- 8036 Jills Creek Dr
- 8056 Windersville Dr
- 8026 Windersville Dr
- 8056 Jills Creek Dr
- 8030 Jills Creek Dr
- 8023 Jills Creek Dr
- 3629 Country Lane Dr
- 8062 Jills Creek Dr
- 8024 Jills Creek Dr