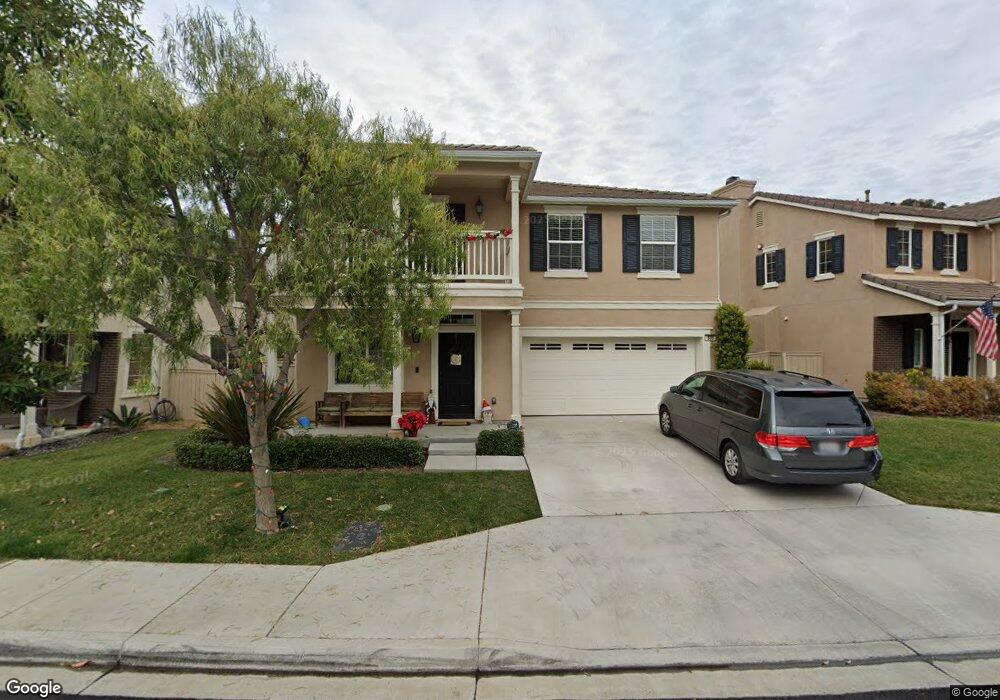
805 Arbor Glen Ln Vista, CA 92081
Shadowridge NeighborhoodEstimated Value: $1,020,000 - $1,121,000
4
Beds
3
Baths
2,693
Sq Ft
$396/Sq Ft
Est. Value
About This Home
This home is located at 805 Arbor Glen Ln, Vista, CA 92081 and is currently estimated at $1,066,711, approximately $396 per square foot. 805 Arbor Glen Ln is a home with nearby schools including Joli Ann Leichtag Elementary School, San Marcos Middle School, and San Marcos High School.
Ownership History
Date
Name
Owned For
Owner Type
Purchase Details
Closed on
Oct 21, 2021
Sold by
Reitz Stephen I
Bought by
Reitz Beverly L
Current Estimated Value
Home Financials for this Owner
Home Financials are based on the most recent Mortgage that was taken out on this home.
Original Mortgage
$583,980
Outstanding Balance
$532,535
Interest Rate
2.8%
Mortgage Type
New Conventional
Estimated Equity
$534,176
Purchase Details
Closed on
Mar 21, 2012
Sold by
Watt Communities At Amber Woods Llc
Bought by
Reitz Beverly L and Reitz Stephen I
Home Financials for this Owner
Home Financials are based on the most recent Mortgage that was taken out on this home.
Original Mortgage
$414,853
Interest Rate
3.86%
Mortgage Type
FHA
Purchase Details
Closed on
Dec 1, 2008
Sold by
Cwh Amber 58 Llc
Bought by
Bank Of America National Association
Create a Home Valuation Report for This Property
The Home Valuation Report is an in-depth analysis detailing your home's value as well as a comparison with similar homes in the area
Home Values in the Area
Average Home Value in this Area
Purchase History
| Date | Buyer | Sale Price | Title Company |
|---|---|---|---|
| Reitz Beverly L | $235,000 | Lawyers Title Oc | |
| Reitz Beverly L | $430,000 | First American Title Company | |
| Bank Of America National Association | $4,545,750 | Chicago Title |
Source: Public Records
Mortgage History
| Date | Status | Borrower | Loan Amount |
|---|---|---|---|
| Open | Reitz Beverly L | $583,980 | |
| Previous Owner | Reitz Beverly L | $414,853 |
Source: Public Records
Tax History Compared to Growth
Tax History
| Year | Tax Paid | Tax Assessment Tax Assessment Total Assessment is a certain percentage of the fair market value that is determined by local assessors to be the total taxable value of land and additions on the property. | Land | Improvement |
|---|---|---|---|---|
| 2025 | $6,481 | $539,965 | $175,842 | $364,123 |
| 2024 | $6,481 | $529,379 | $172,395 | $356,984 |
| 2023 | $6,372 | $519,000 | $169,015 | $349,985 |
| 2022 | $6,294 | $508,824 | $165,701 | $343,123 |
| 2021 | $6,200 | $498,848 | $162,452 | $336,396 |
| 2020 | $6,146 | $493,734 | $160,787 | $332,947 |
| 2019 | $6,084 | $484,054 | $157,635 | $326,419 |
| 2018 | $5,911 | $474,564 | $154,545 | $320,019 |
| 2017 | $5,855 | $465,260 | $151,515 | $313,745 |
| 2016 | $5,776 | $456,139 | $148,545 | $307,594 |
| 2015 | $5,702 | $449,288 | $146,314 | $302,974 |
| 2014 | $5,586 | $440,488 | $143,448 | $297,040 |
Source: Public Records
Map
Nearby Homes
- 839 Brookdale Dr
- 911 Concord Ct
- 2012 Cottage Way
- 718 Sycamore Ave Unit 21
- 718 Sycamore Ave Unit 109
- 718 Sycamore Ave Unit 195
- 718 Sycamore Ave Unit 170
- 718 Sycamore Ave Unit 115
- 718 Sycamore Ave Unit 23
- 718 Sycamore Ave Unit 44
- 718 Sycamore Ave Unit 134
- 1060 Kendale Way
- 954 Sheffield Dr
- 538 Plumosa Ave
- 1025 Brewley Ln
- 1091 Shadowridge Dr Unit 114
- 2436 Links Way
- 1065 Brewley Ln
- 1109 Countrywood Ln
- 1205 Columbus Way
- 815 Arbor Glen Ln
- 795 Arbor Glen Ln
- 775 Arbor Glen Ln
- 785 Arbor Glen Ln
- 825 Arbor Glen Ln
- 835 Arbor Glen Ln
- 800 Arbor Glen Ln
- 810 Arbor Glen Ln
- 790 Arbor Glen Ln
- 820 Arbor Glen Ln
- 830 Arbor Glen Ln
- 770 Arbor Glen Ln
- 845 Arbor Glen Ln
- 840 Arbor Glen Ln
- 760 Arbor Glen Ln
- 855 Arbor Glen Ln
- 850 Arbor Glen Ln
- 740 Arbor Glen Ln
- 865 Arbor Glen Ln
- 730 Arbor Glen Ln